
Overview
Analytics by UnifyApps enables comprehensive data analysis and reporting capabilities. This means you can aggregate metadata, run SQL queries, and export reports in various formats (CSV, XLS or XLSX), making it perfect for generating insights, performance monitoring, and data-driven decision-making.
.png&w=1080&q=75)
.png)
Use Cases
Customer Segmentation Analysis
Run an Analytics Query to group customers by location or purchase history using projections like count or distinct count. This can help identify key demographics and tailor marketing efforts accordingly.Multi-Source Data Integration
Aggregate data from various sources (e.g., user activity, transaction logs, product reviews) using SQL queries by using Execute Analytics SQL Query. Join tables across multiple platforms to identify patterns and correlations, such as understanding how customer behavior correlates with product sales over time.Automated Quarterly Budget Reports
A finance team automates the generation of quarterly budget reports using the Export Reports action. By setting time ranges and defining projections, they export summarized financial data (like revenue and expenses) in XLSX format. The reports are then shared with stakeholders for review, ensuring timely, accurate data for decision-making, and saving manual report-generation time.Retrieving Metadata for Specific Fields
A user working within the Platform group wants to gather detailed metadata for fields such as Customer_Name, Customer_Age, and Customer_Location. They utilize the Aggregate Metadata action and specify these fields in the Add ID section.
Aggregate Metadata
.png&w=1080&q=75)
.png)
The Aggregate Metadata action in Analytics by UnifyApps enables users to retrieve and explore detailed metadata for data fields within a specific object. It provides crucial insights into field properties such as whether they are sortable, filterable, searchable, or updatable, helping users better understand their dataset structure and enabling more efficient data handling.
Input Fields:
.png&w=1080&q=75)
.png)
Group: Select between Storage or Platform to determine the data context.Base Report: Choose the object to query for metadata.Add ID: Specify the field name for metadata extraction.Query: Enter a partial field name to retrieve related metadata. For example, entering "Cus" returns fields like Customers_Profile.Page: Configure pagination with Offset and Limit.Sortable: Enable if you want to retrieve fields that are sortable.Filterable: Enable if you want to retrieve fields that are filterable.
Output:
The action returns detailed metadata for each field, including:
Aggregation Field Type
Display Name
Entity Type
Field Type
Sortable, Filterable and Searchable
Updatable
Name Field
This action simplifies data exploration, particularly for large datasets, by allowing users to understand field properties quickly without needing to manually search through the data.
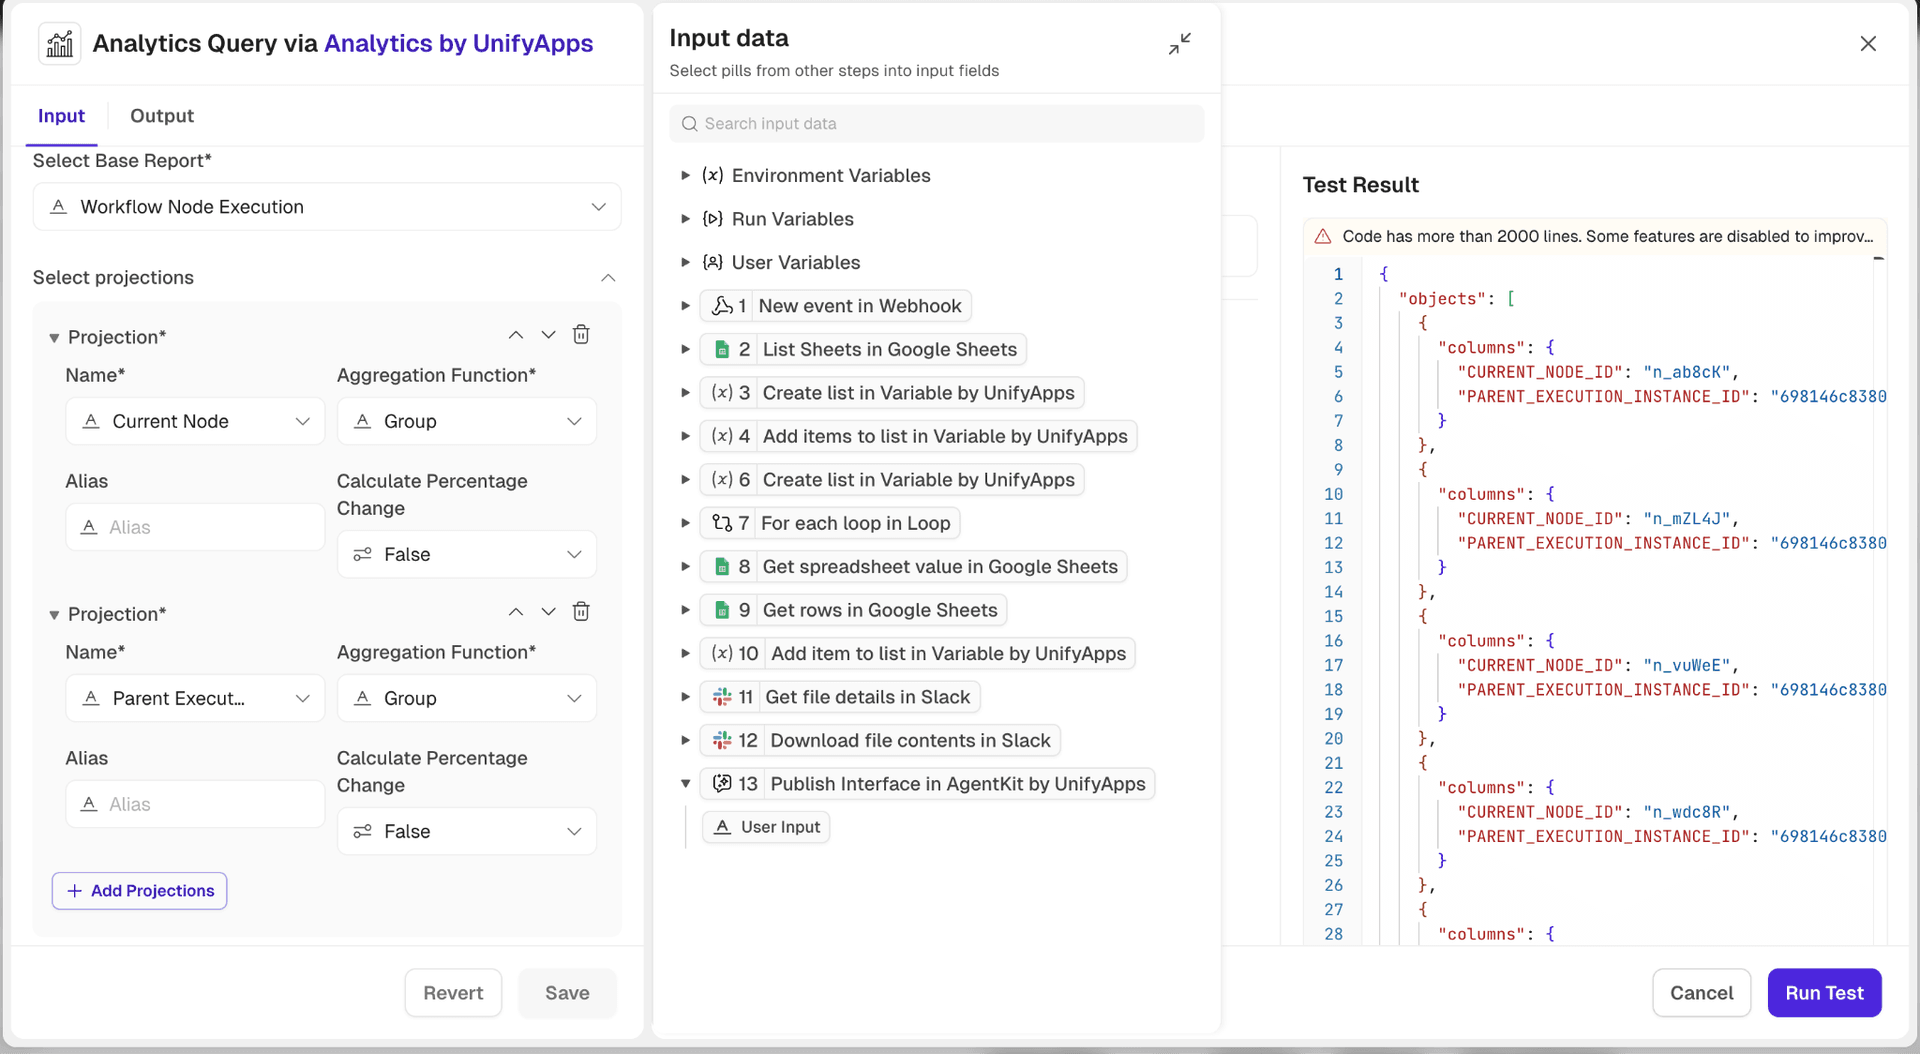
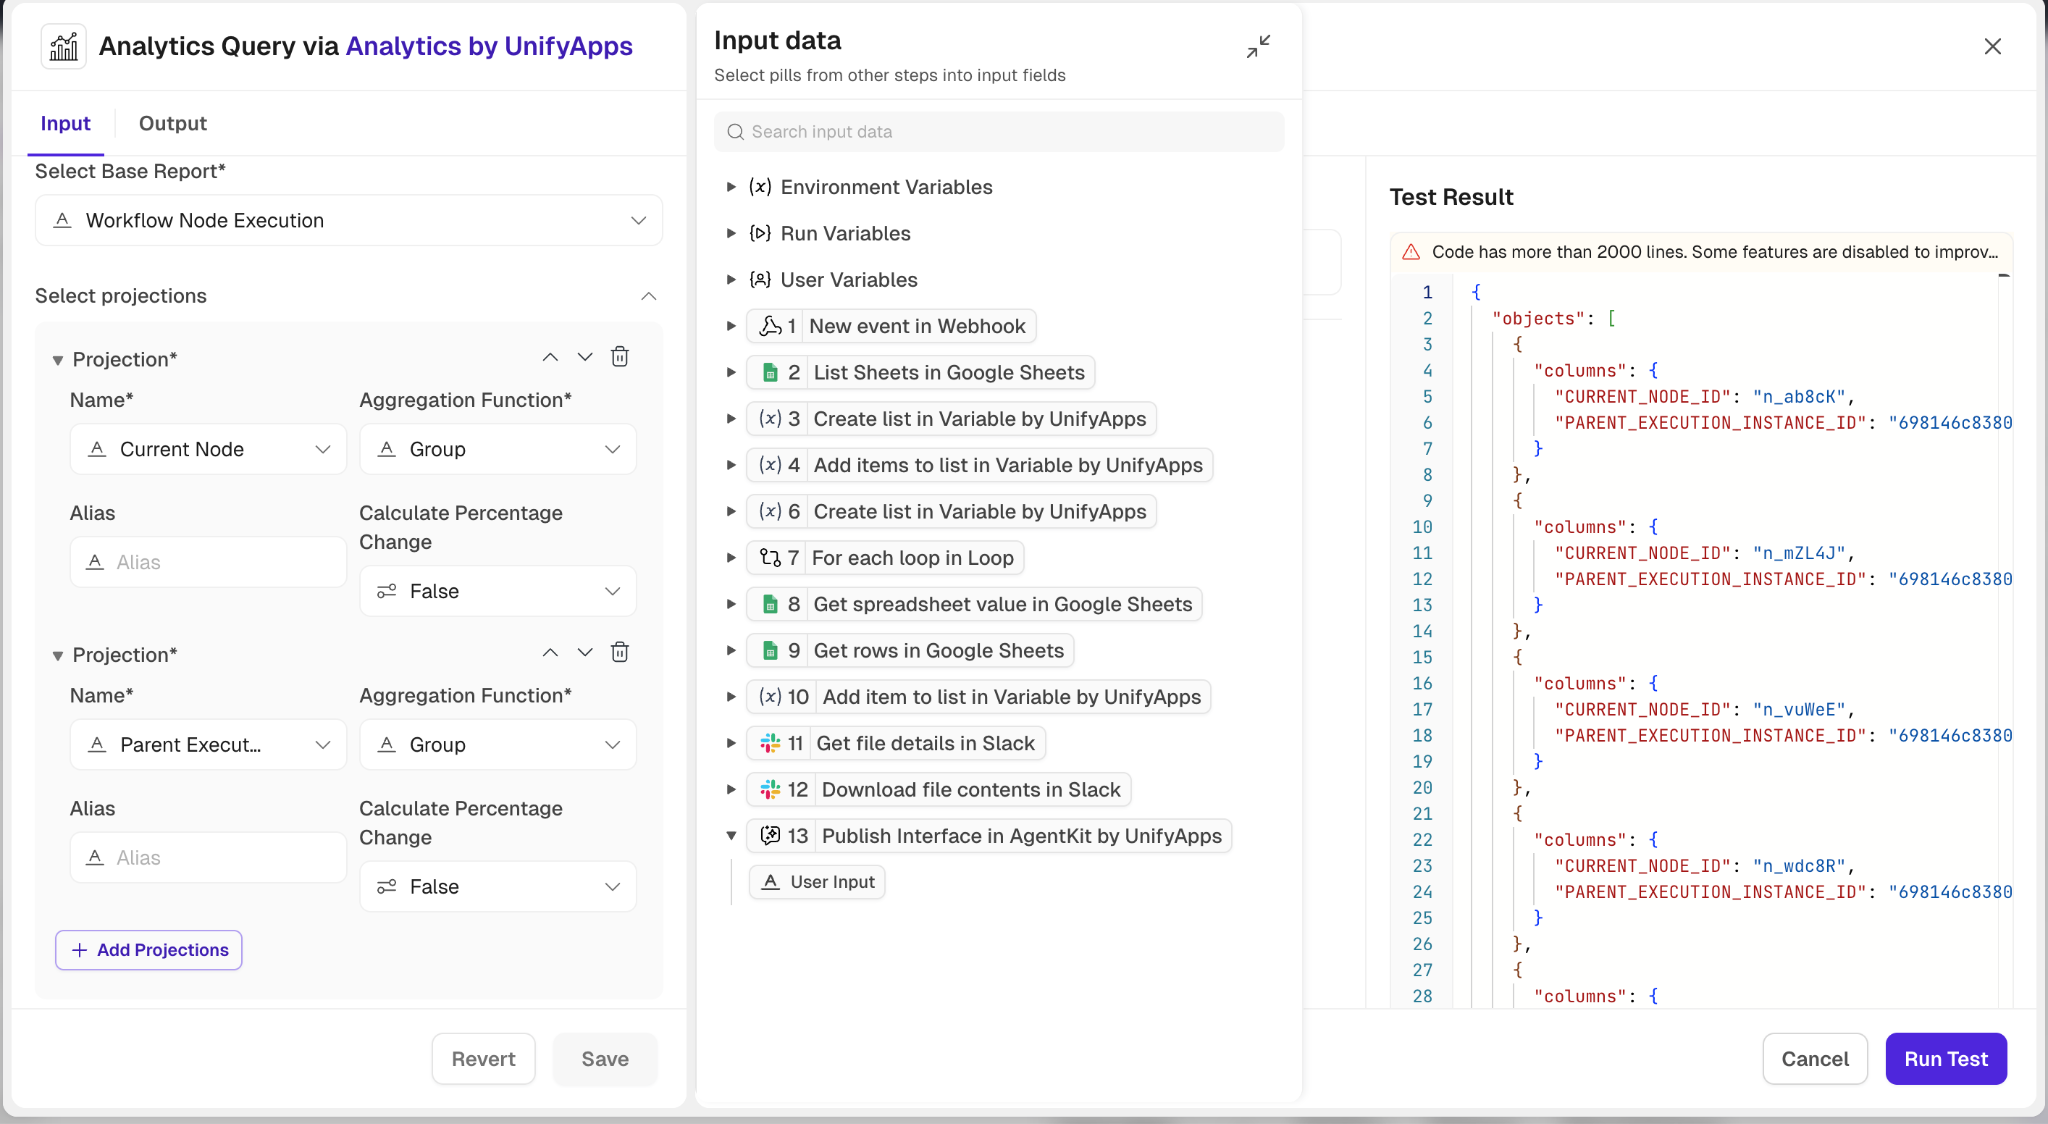
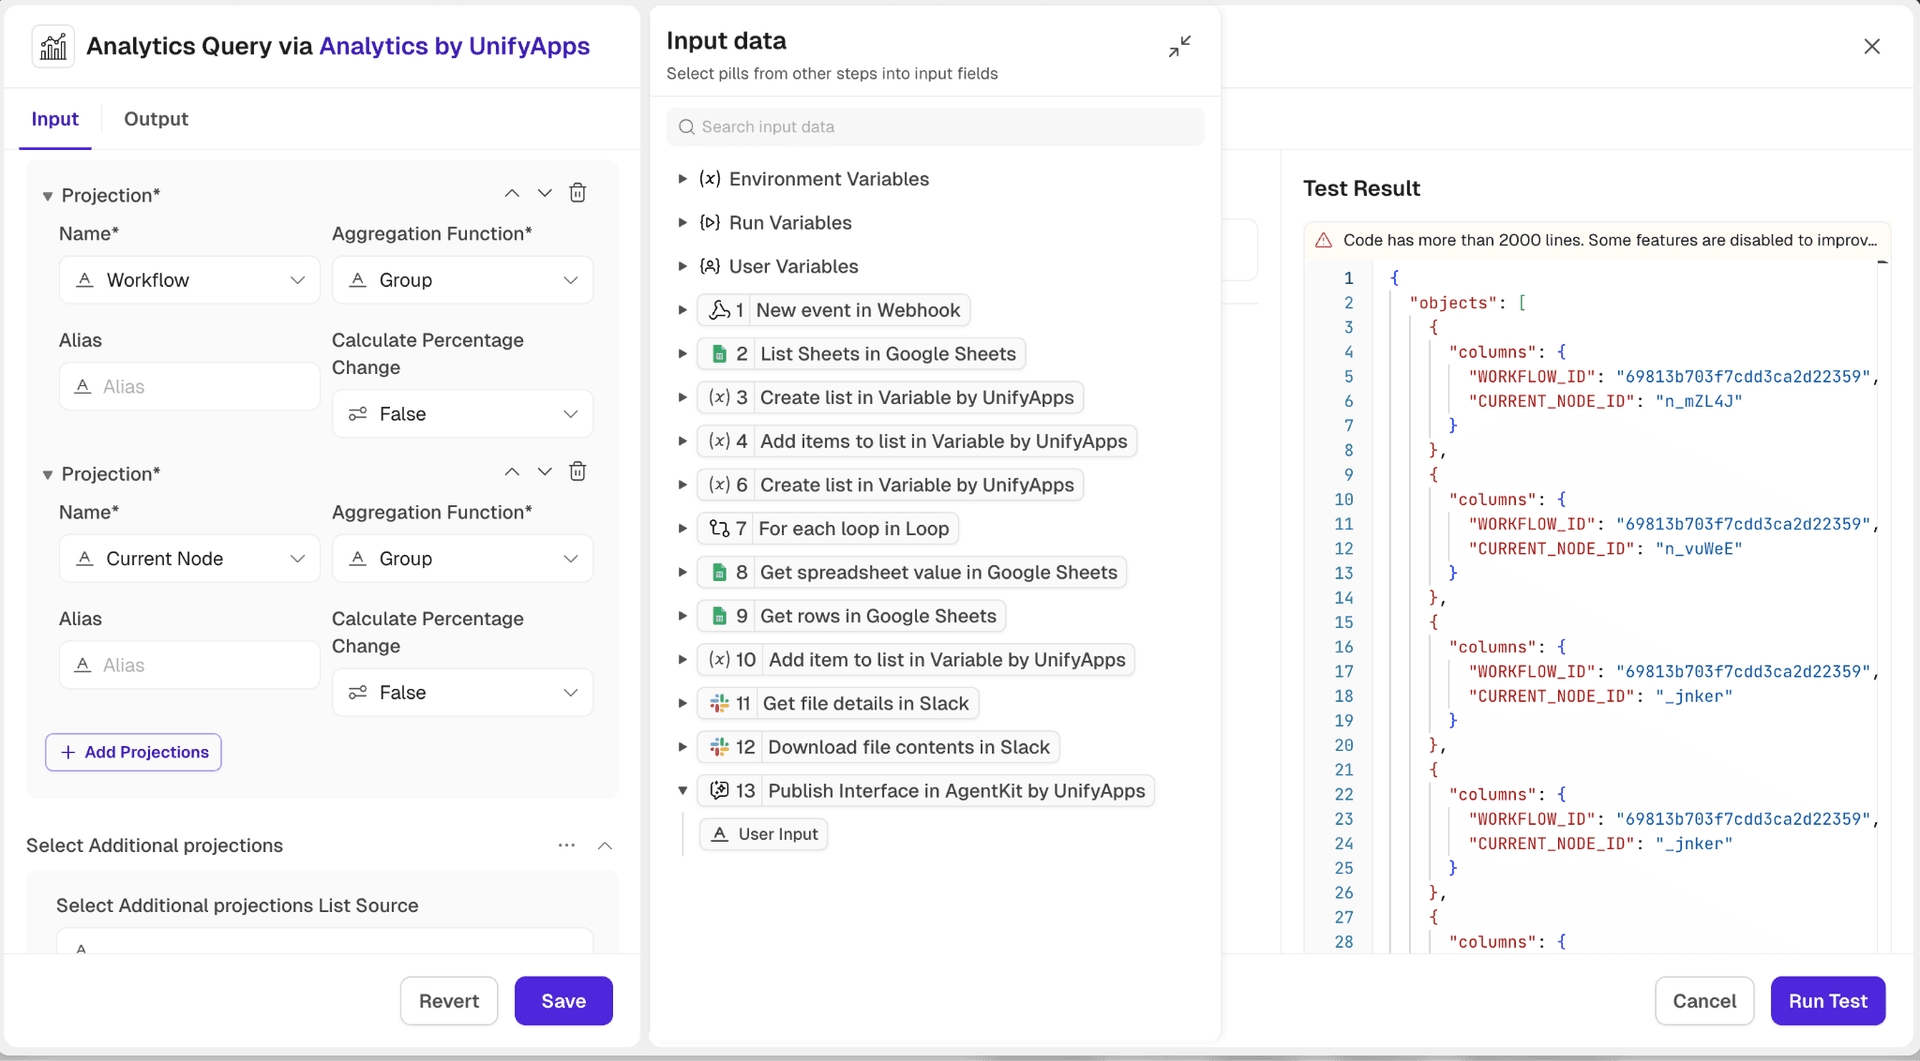
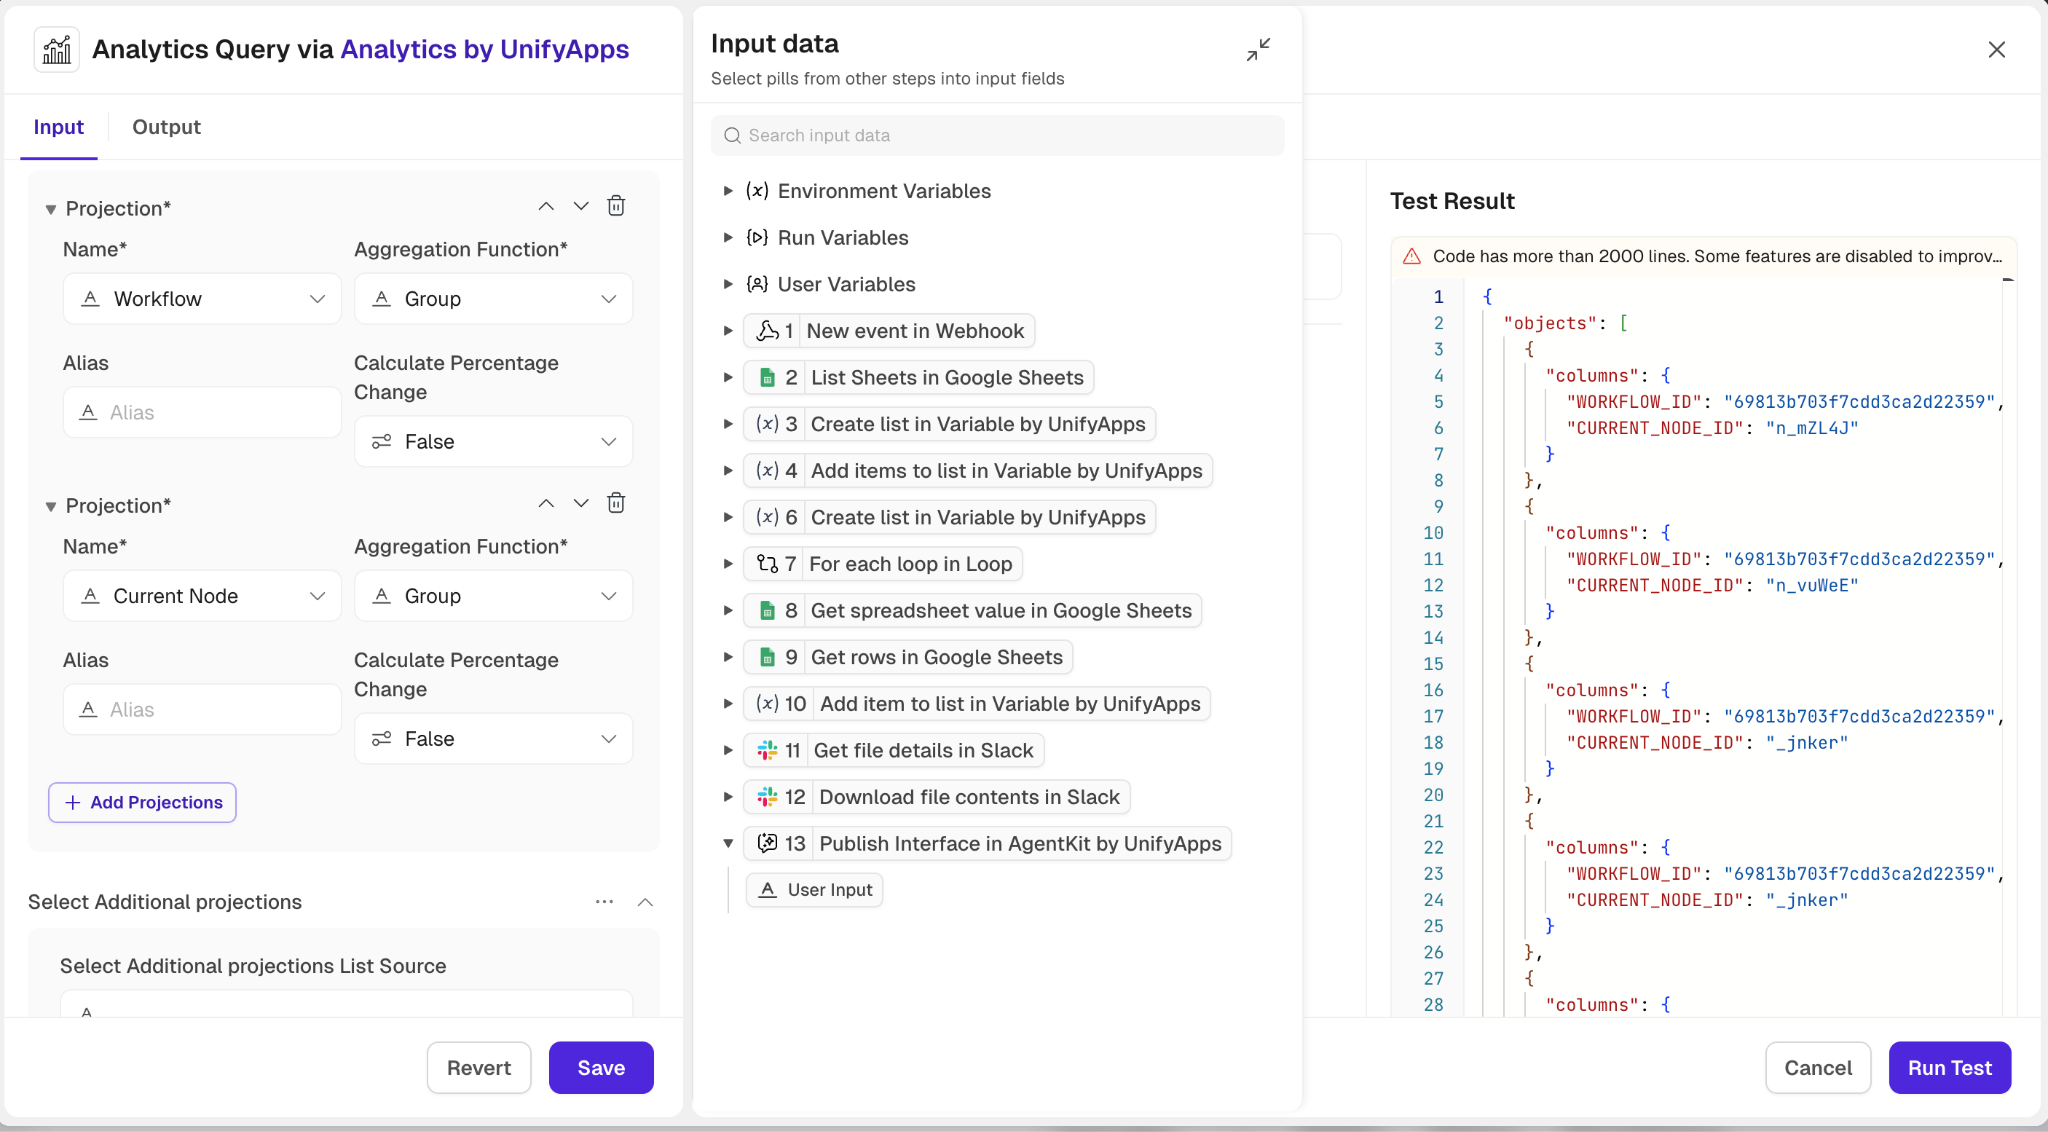
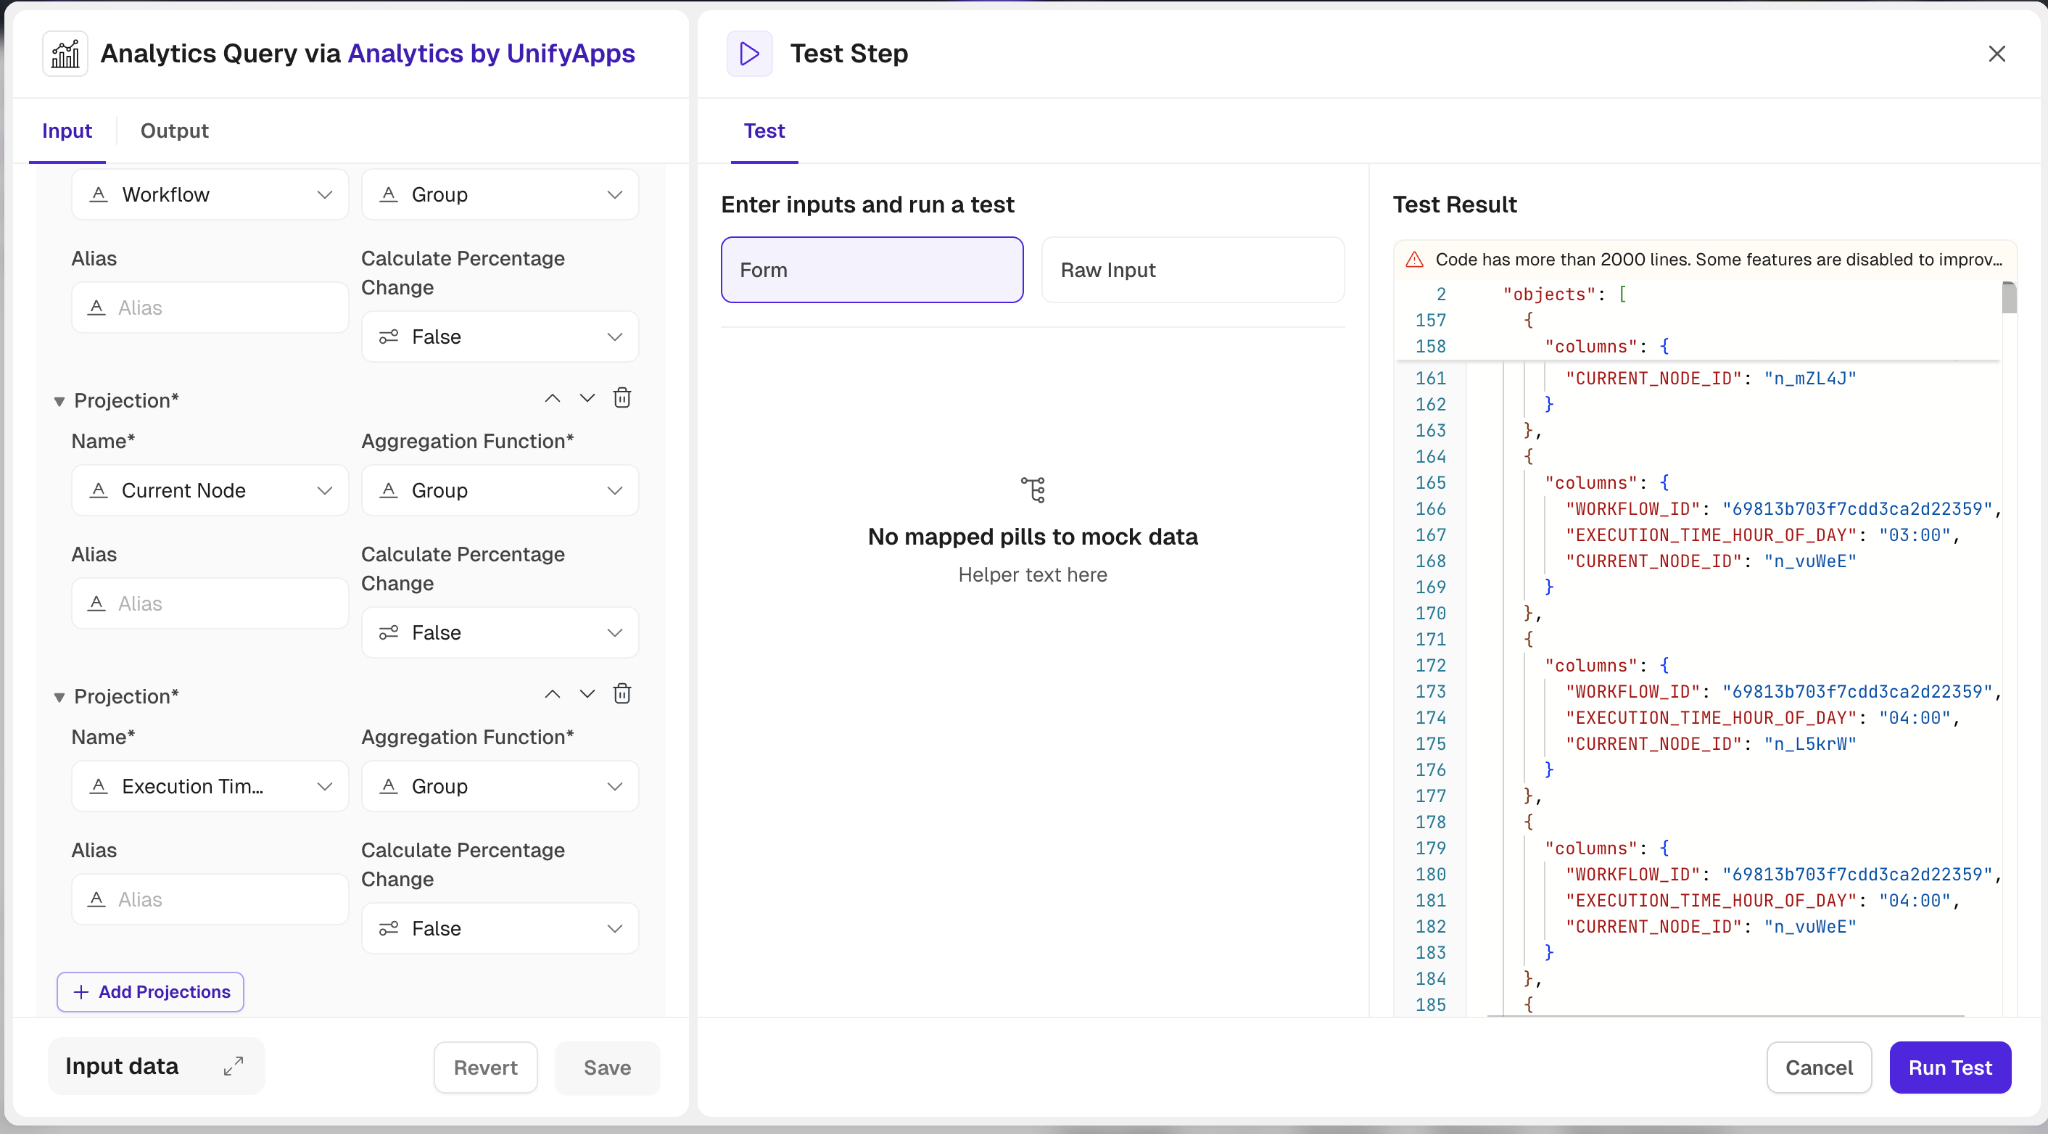
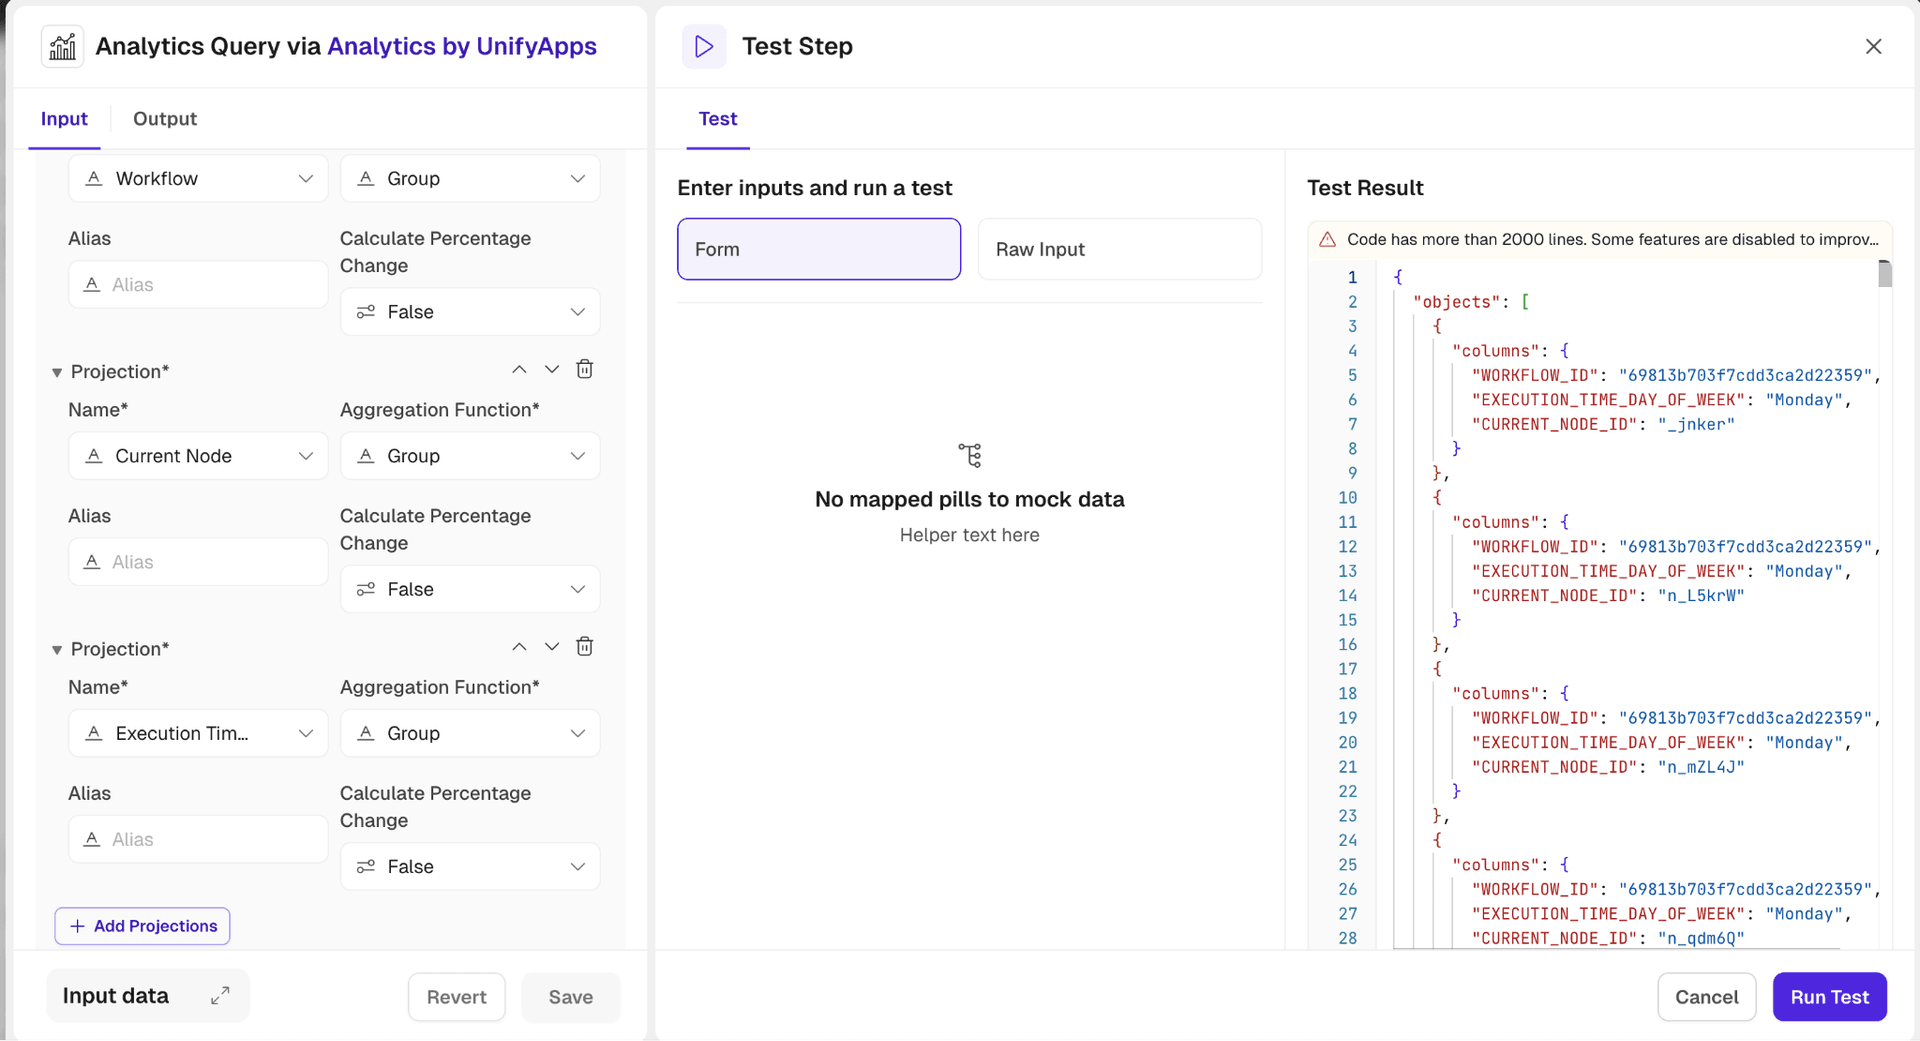
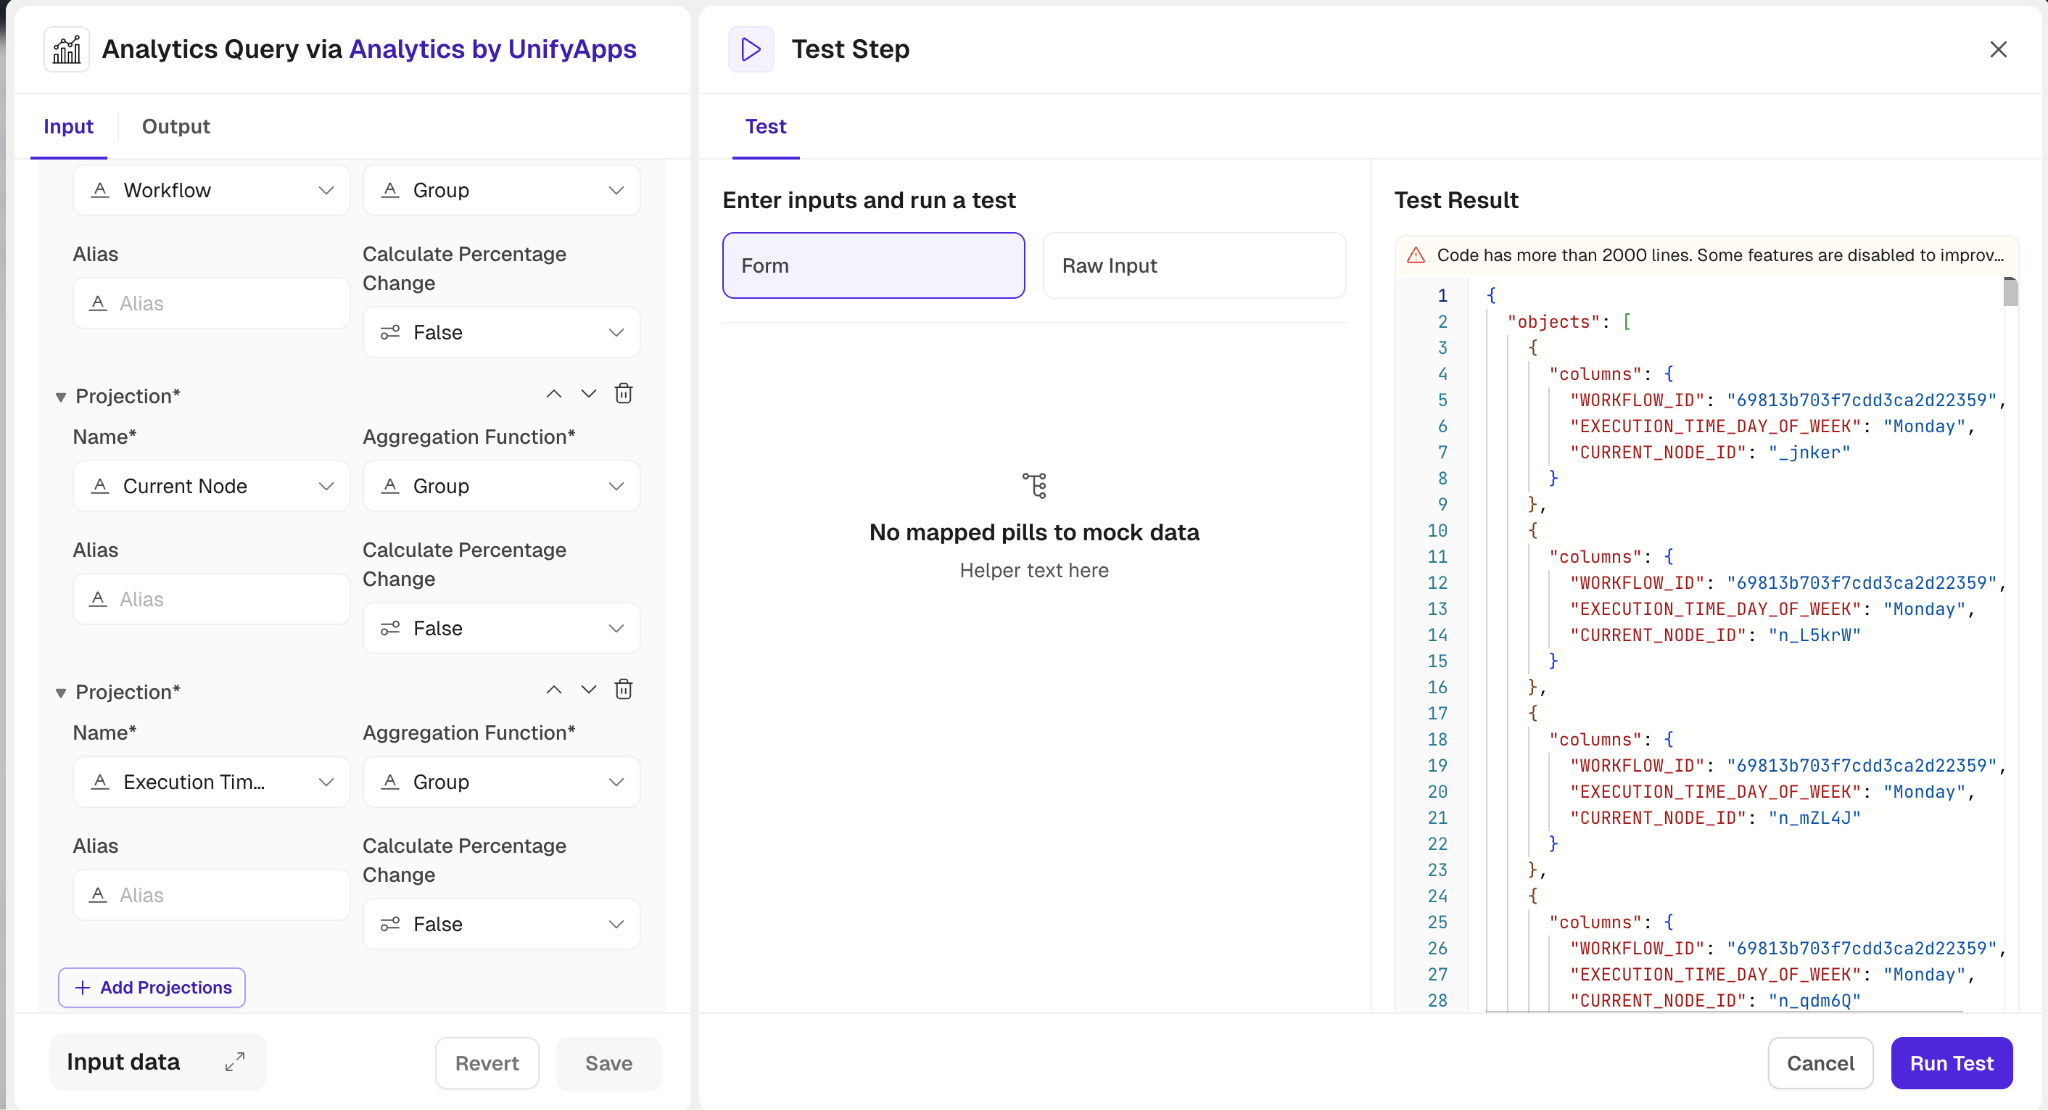
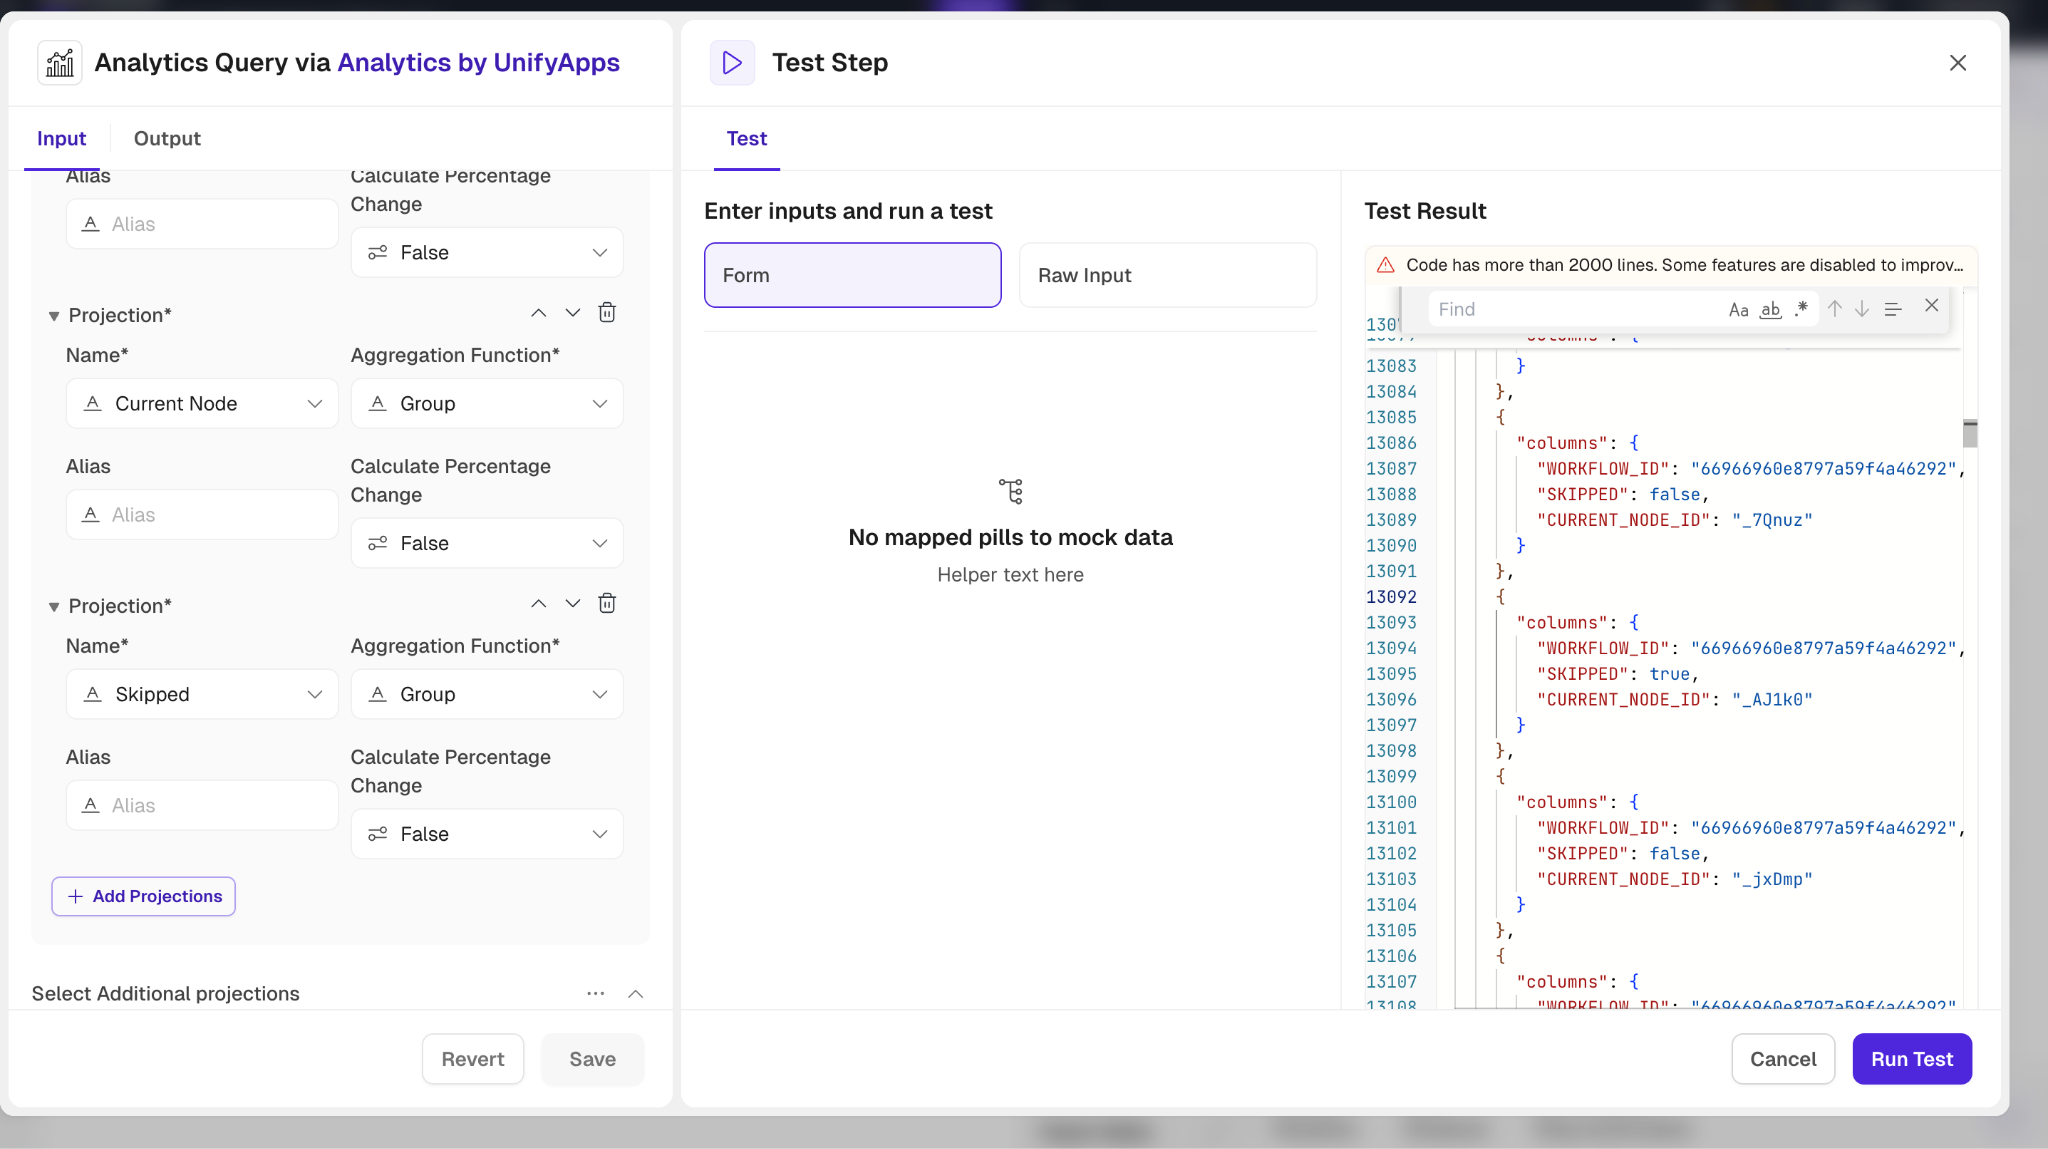
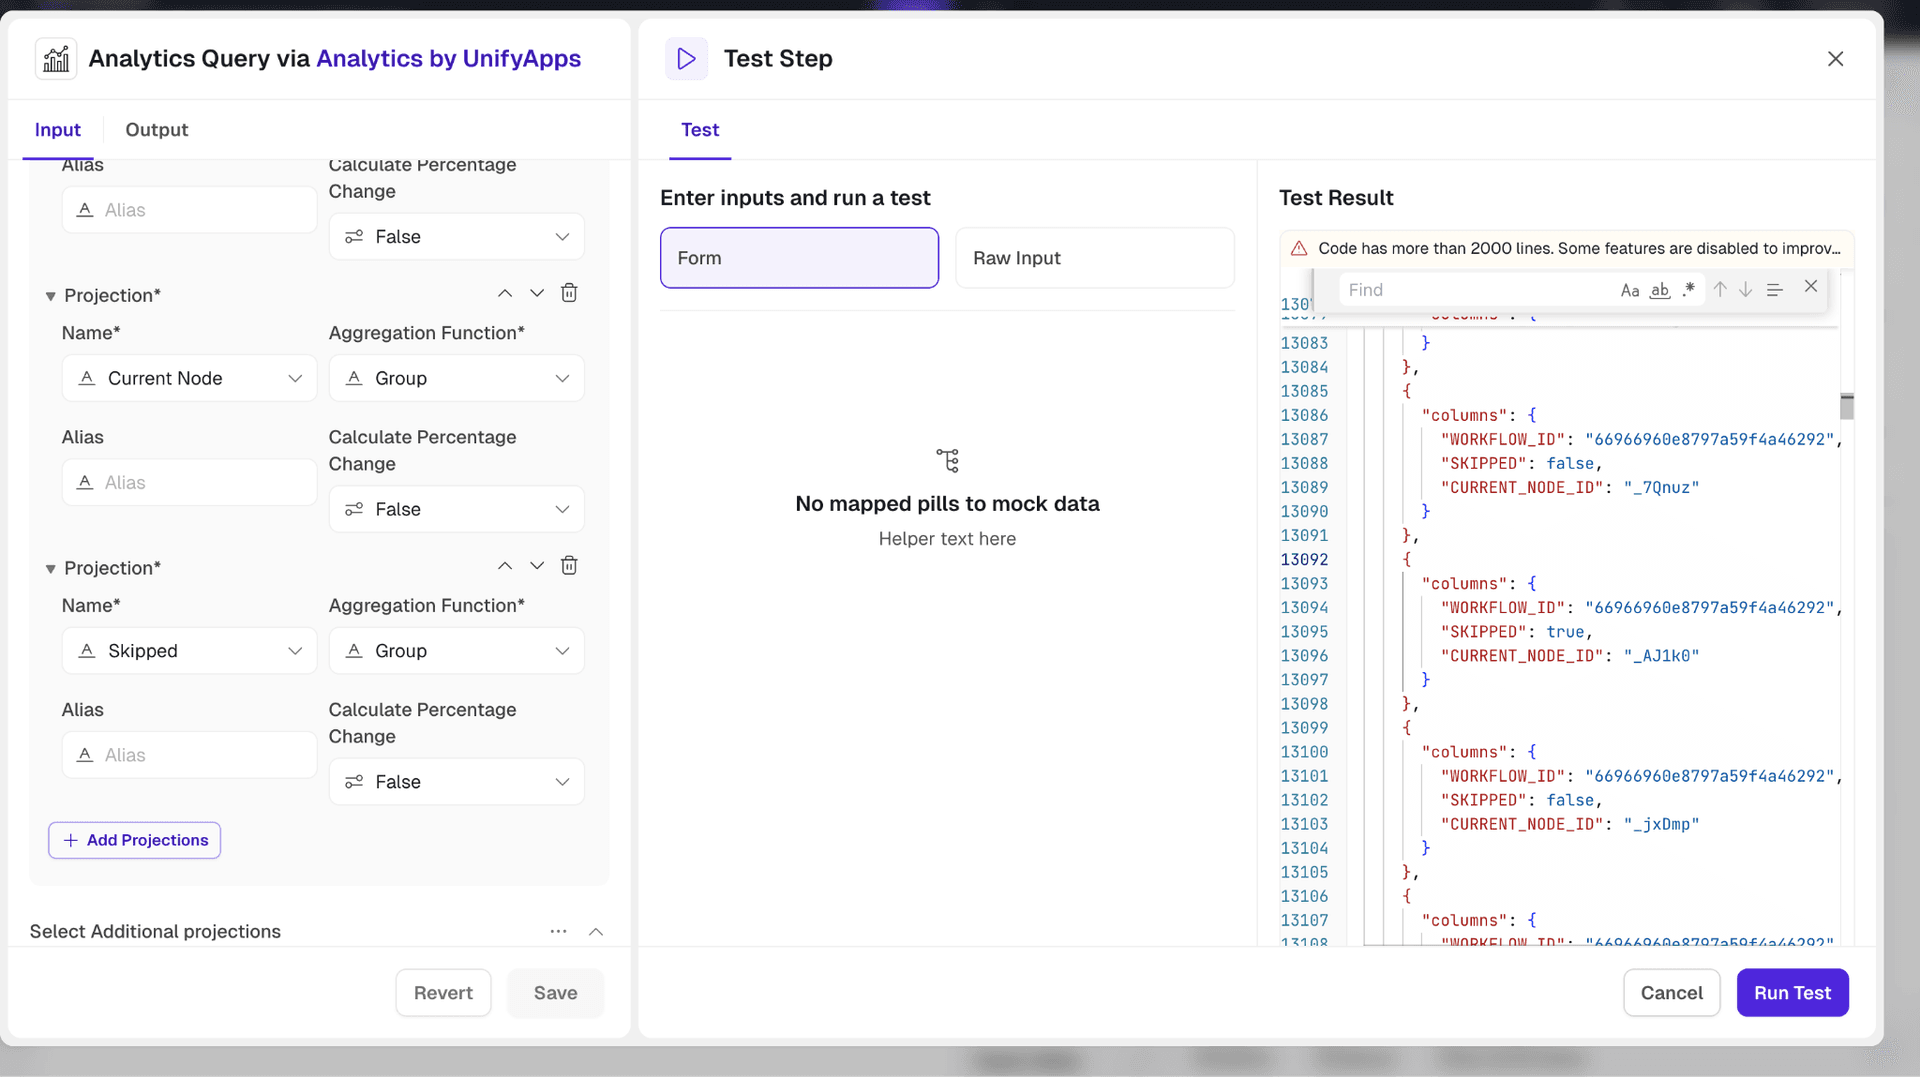
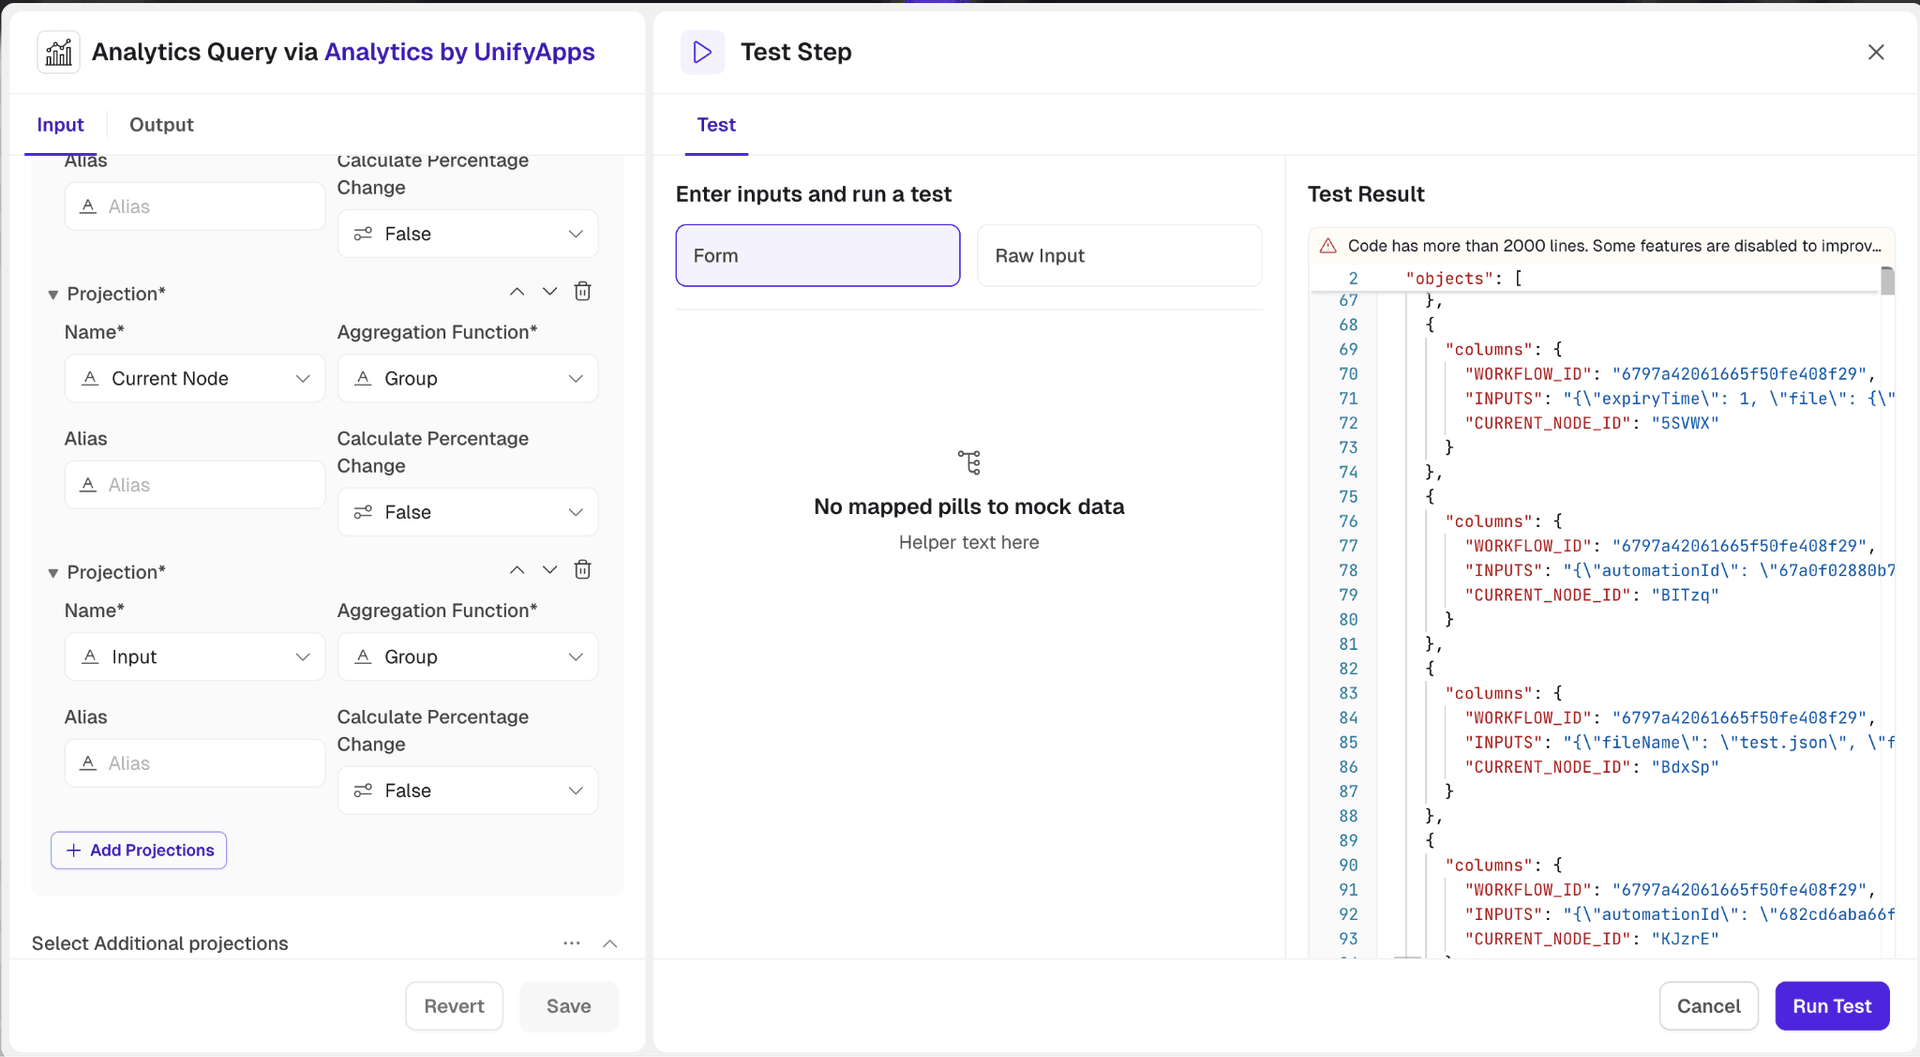
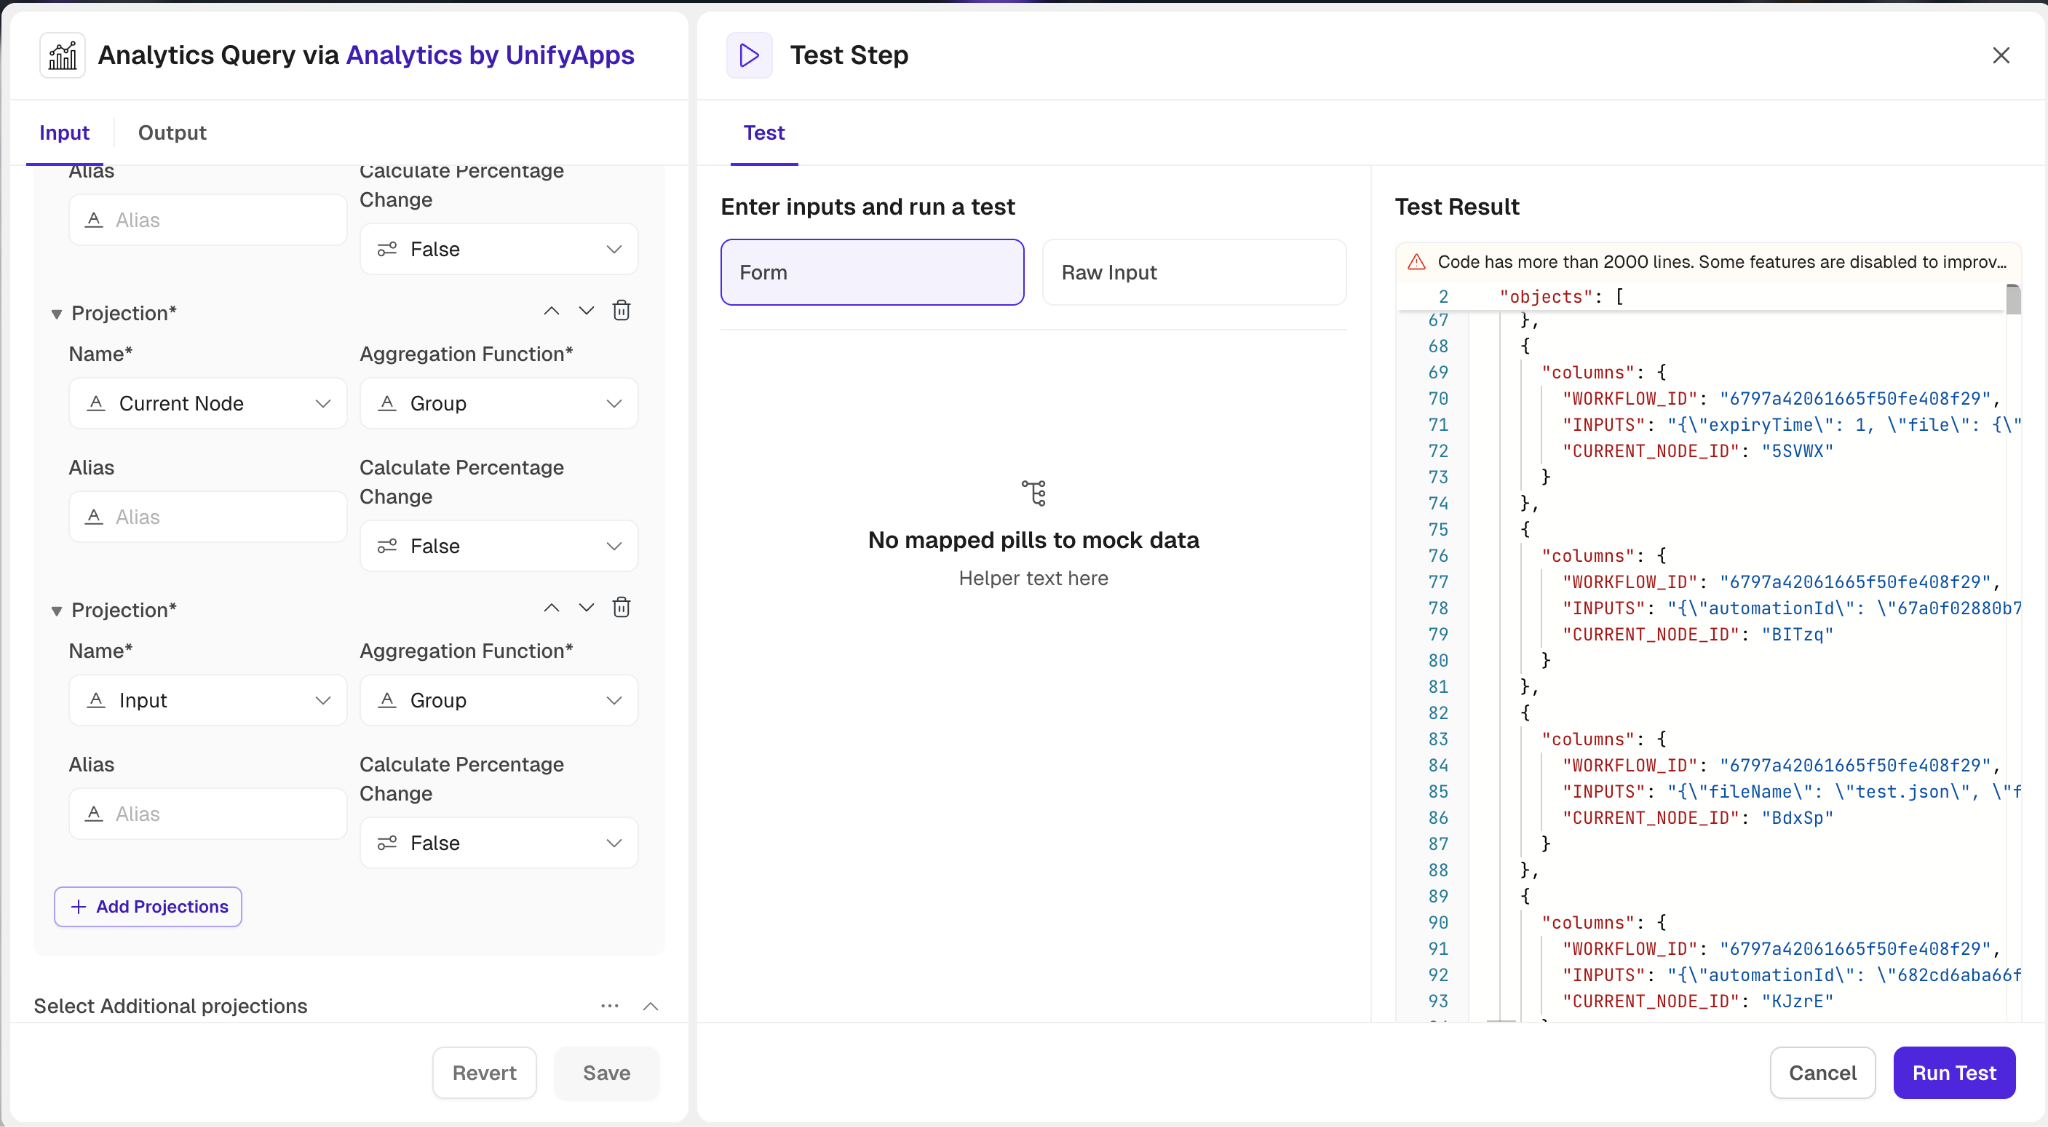
Analytics Query
.png&w=1080&q=75)
.png)
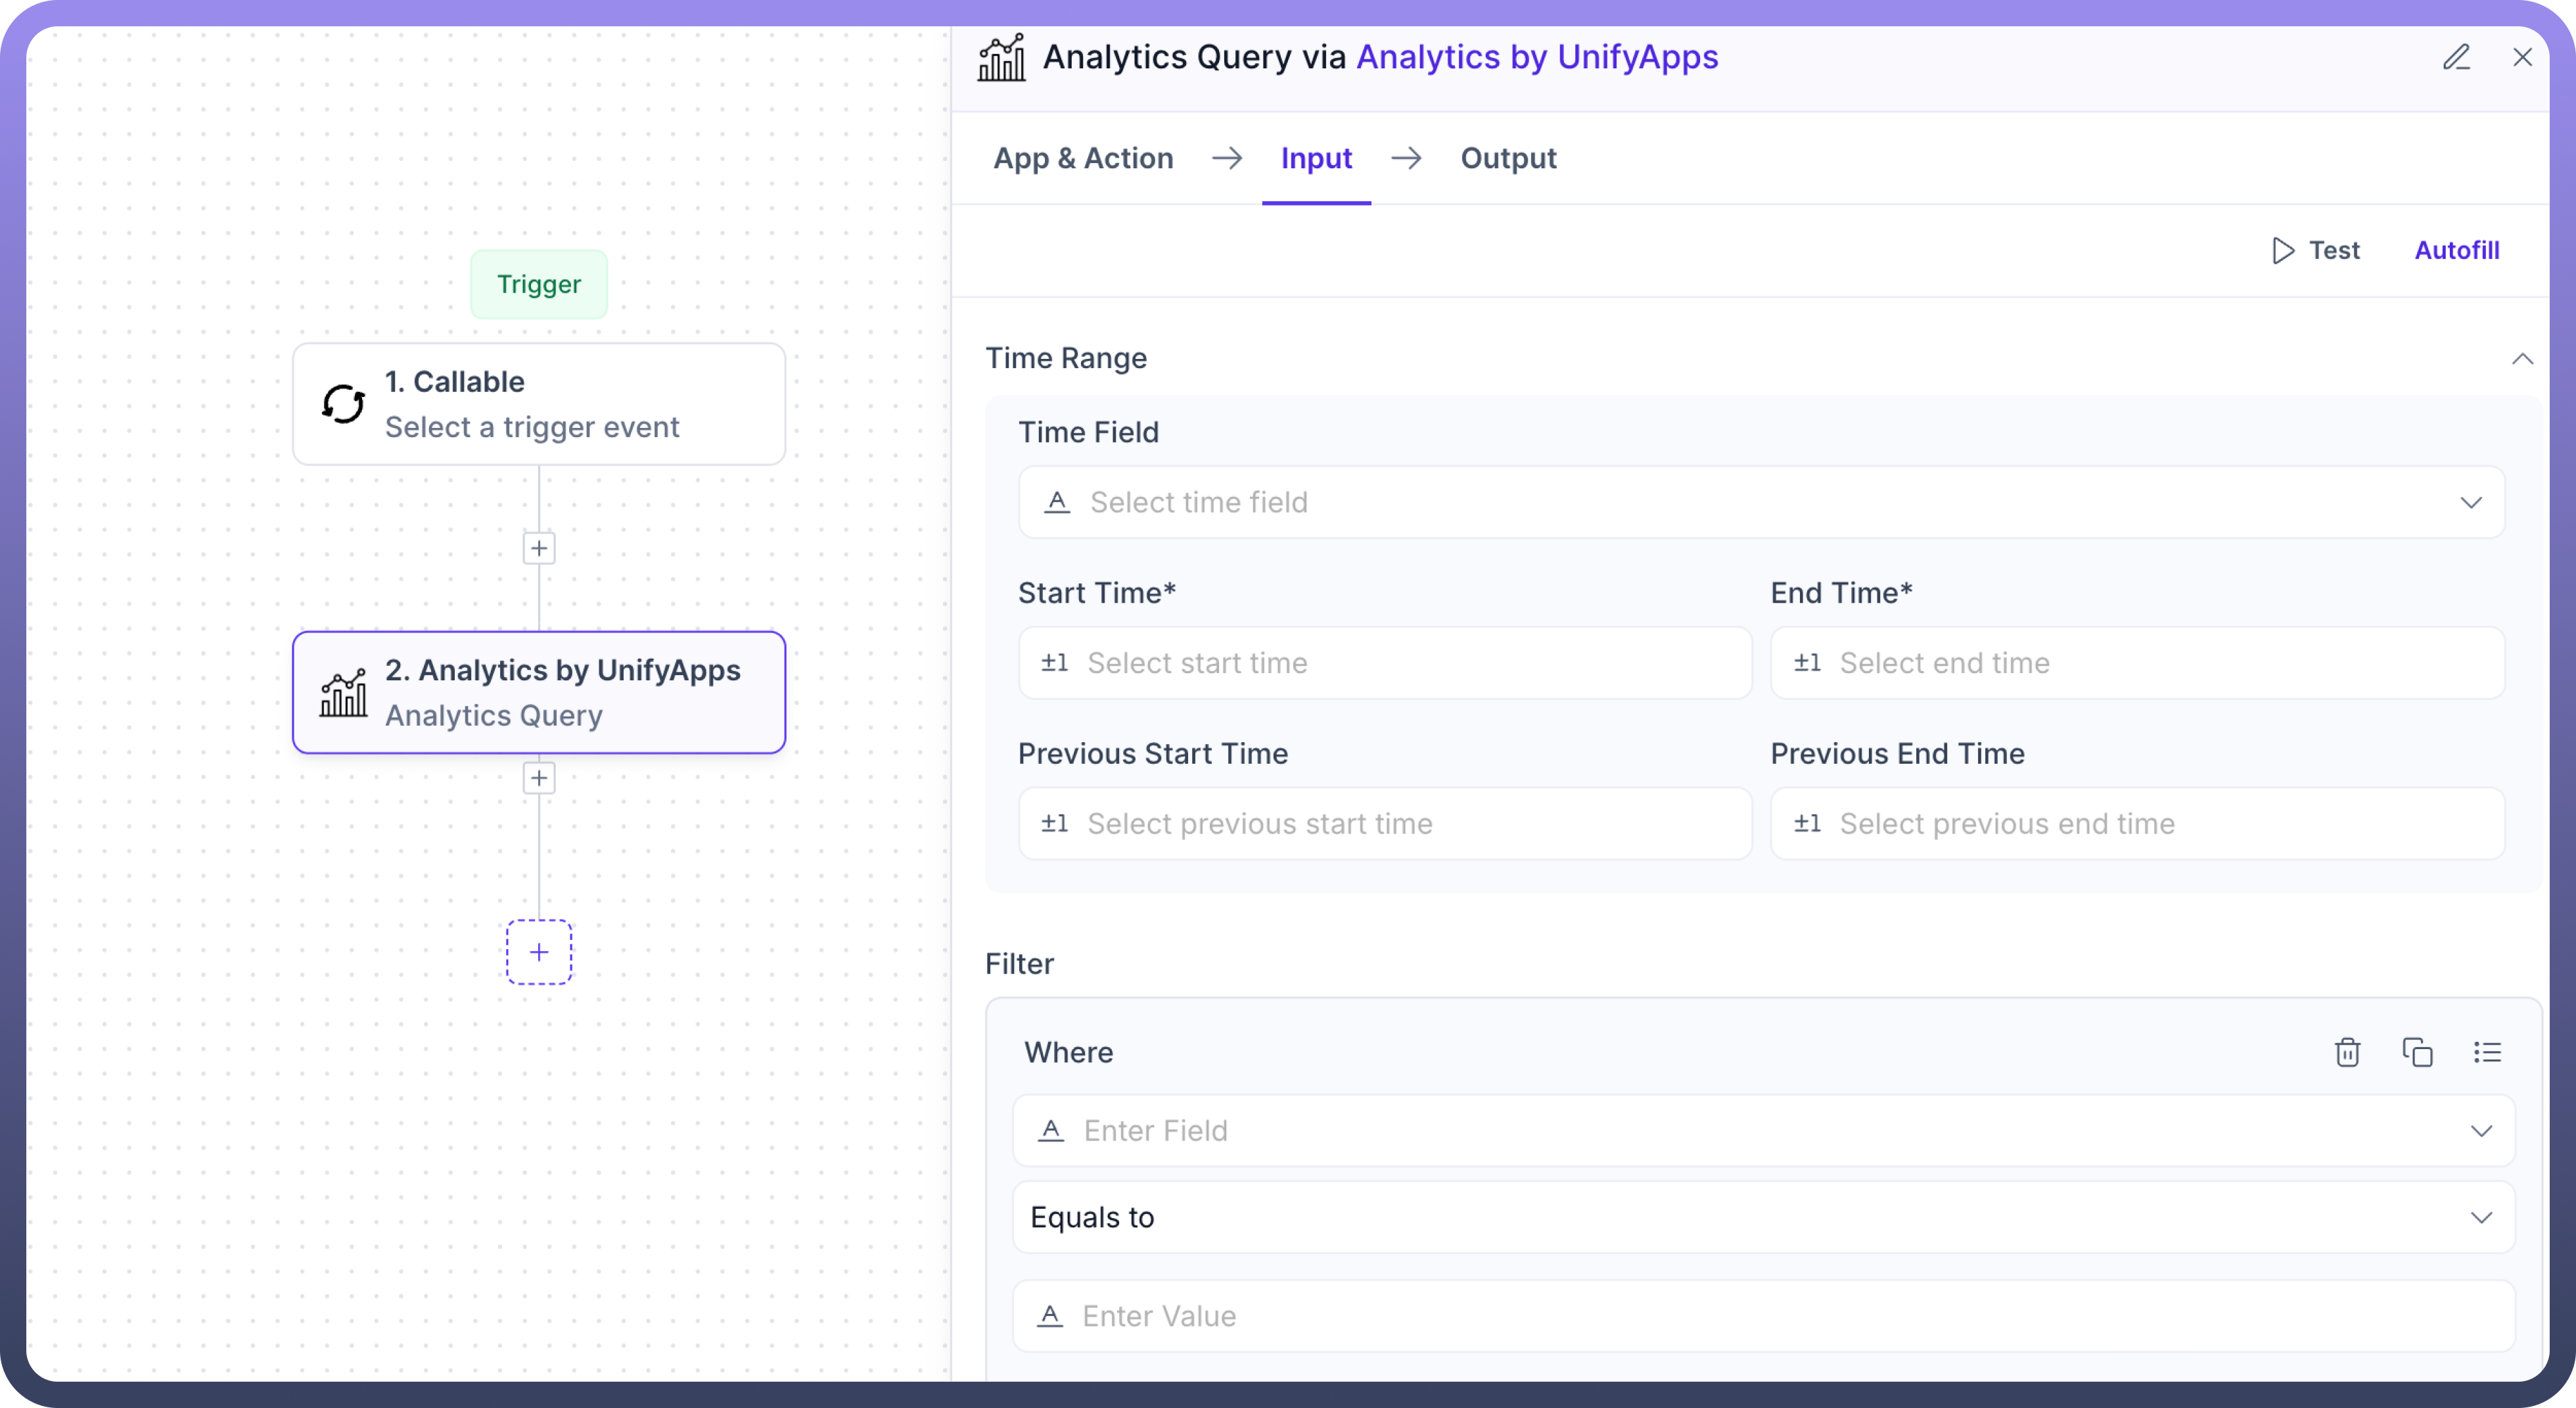
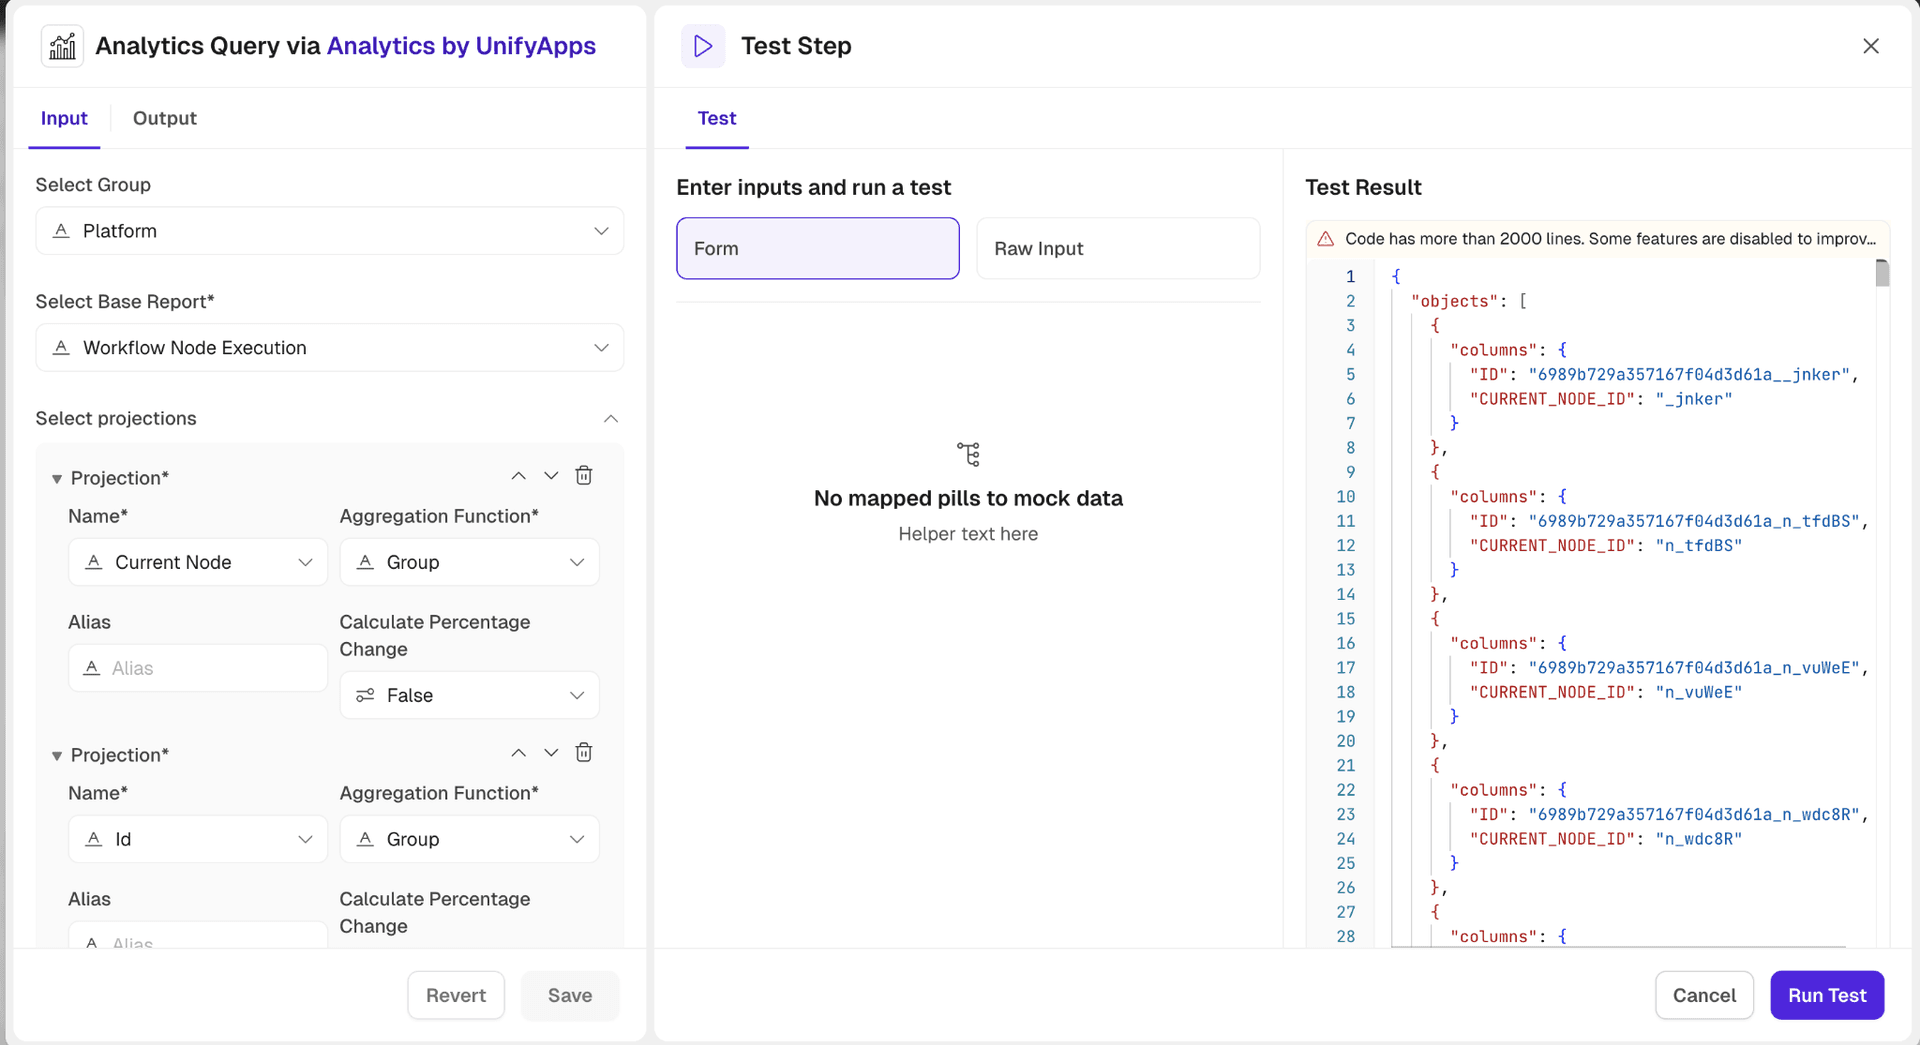
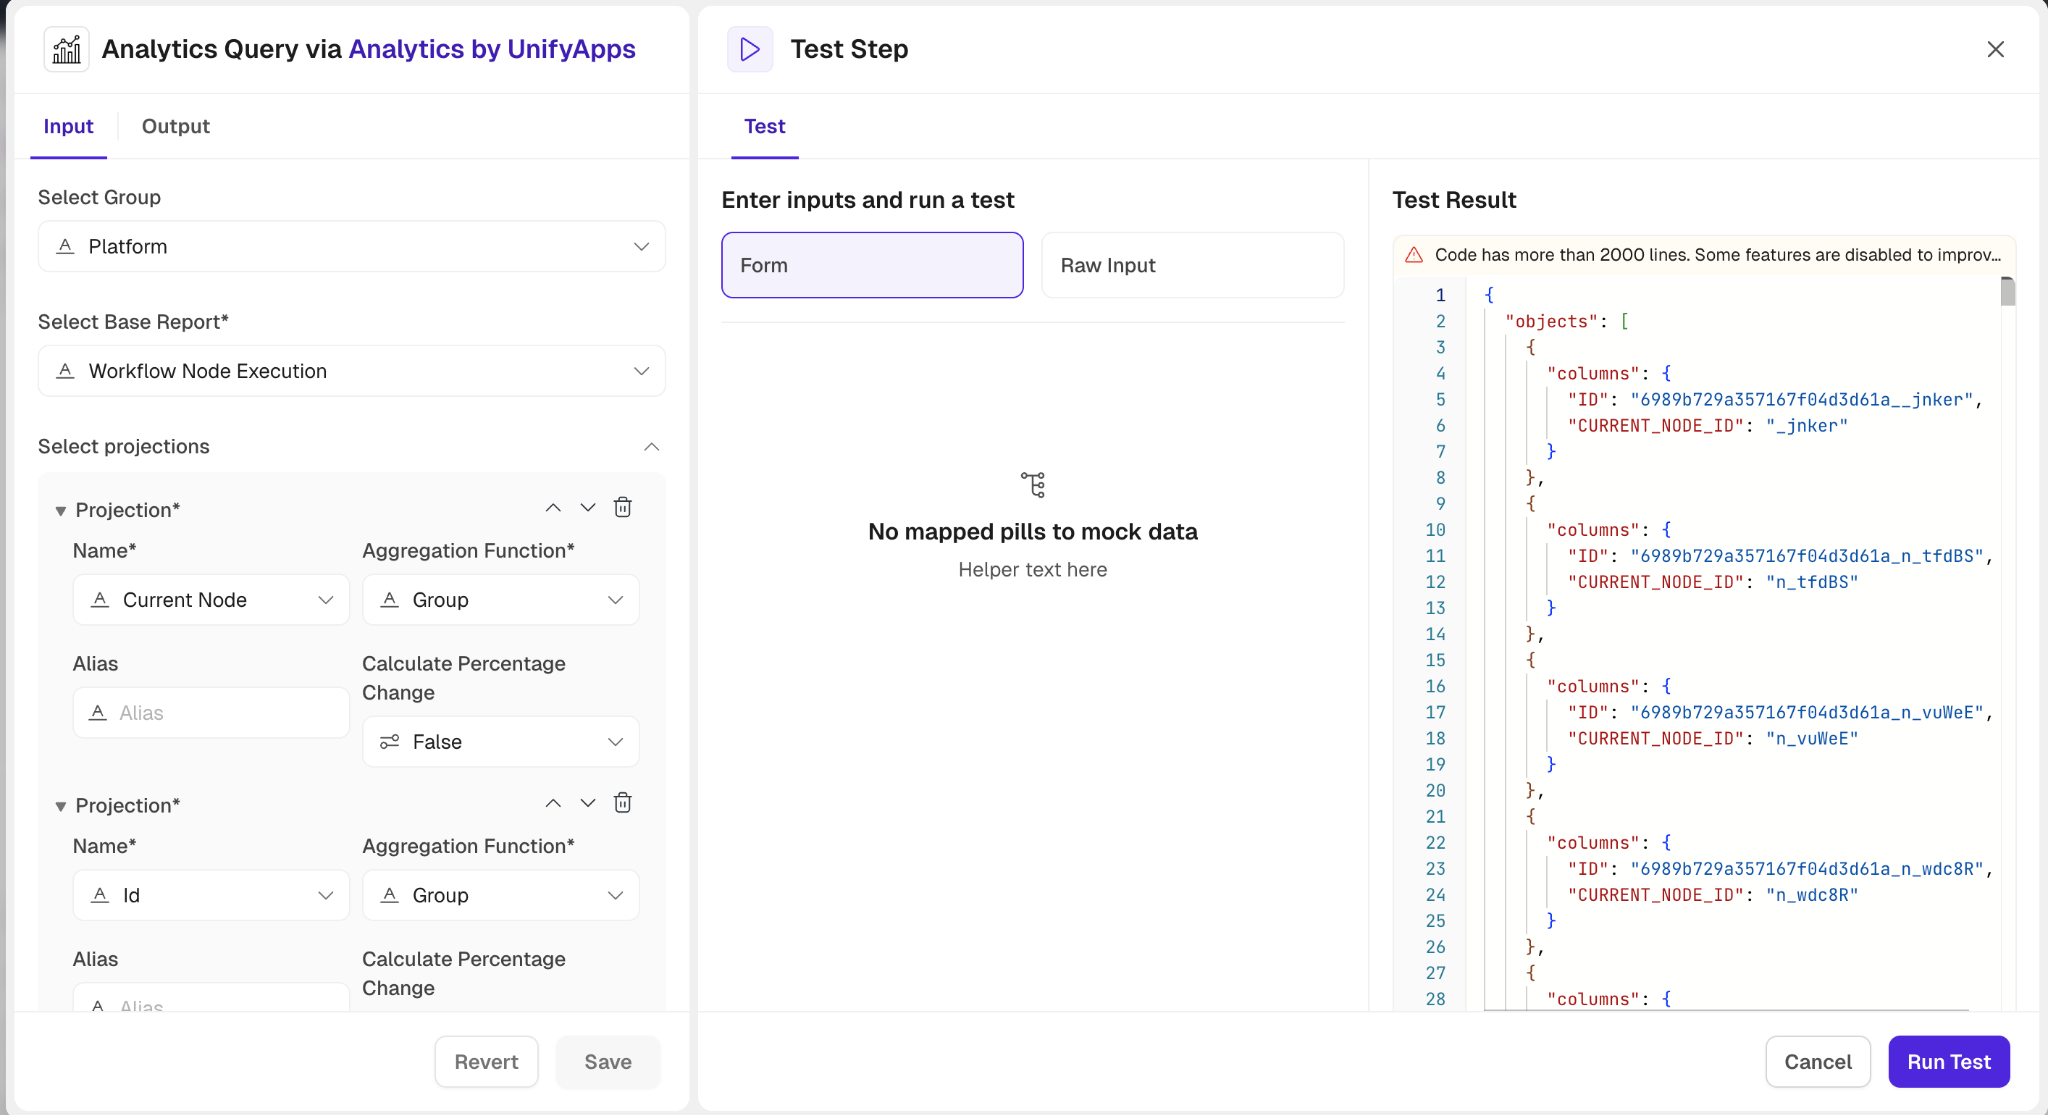
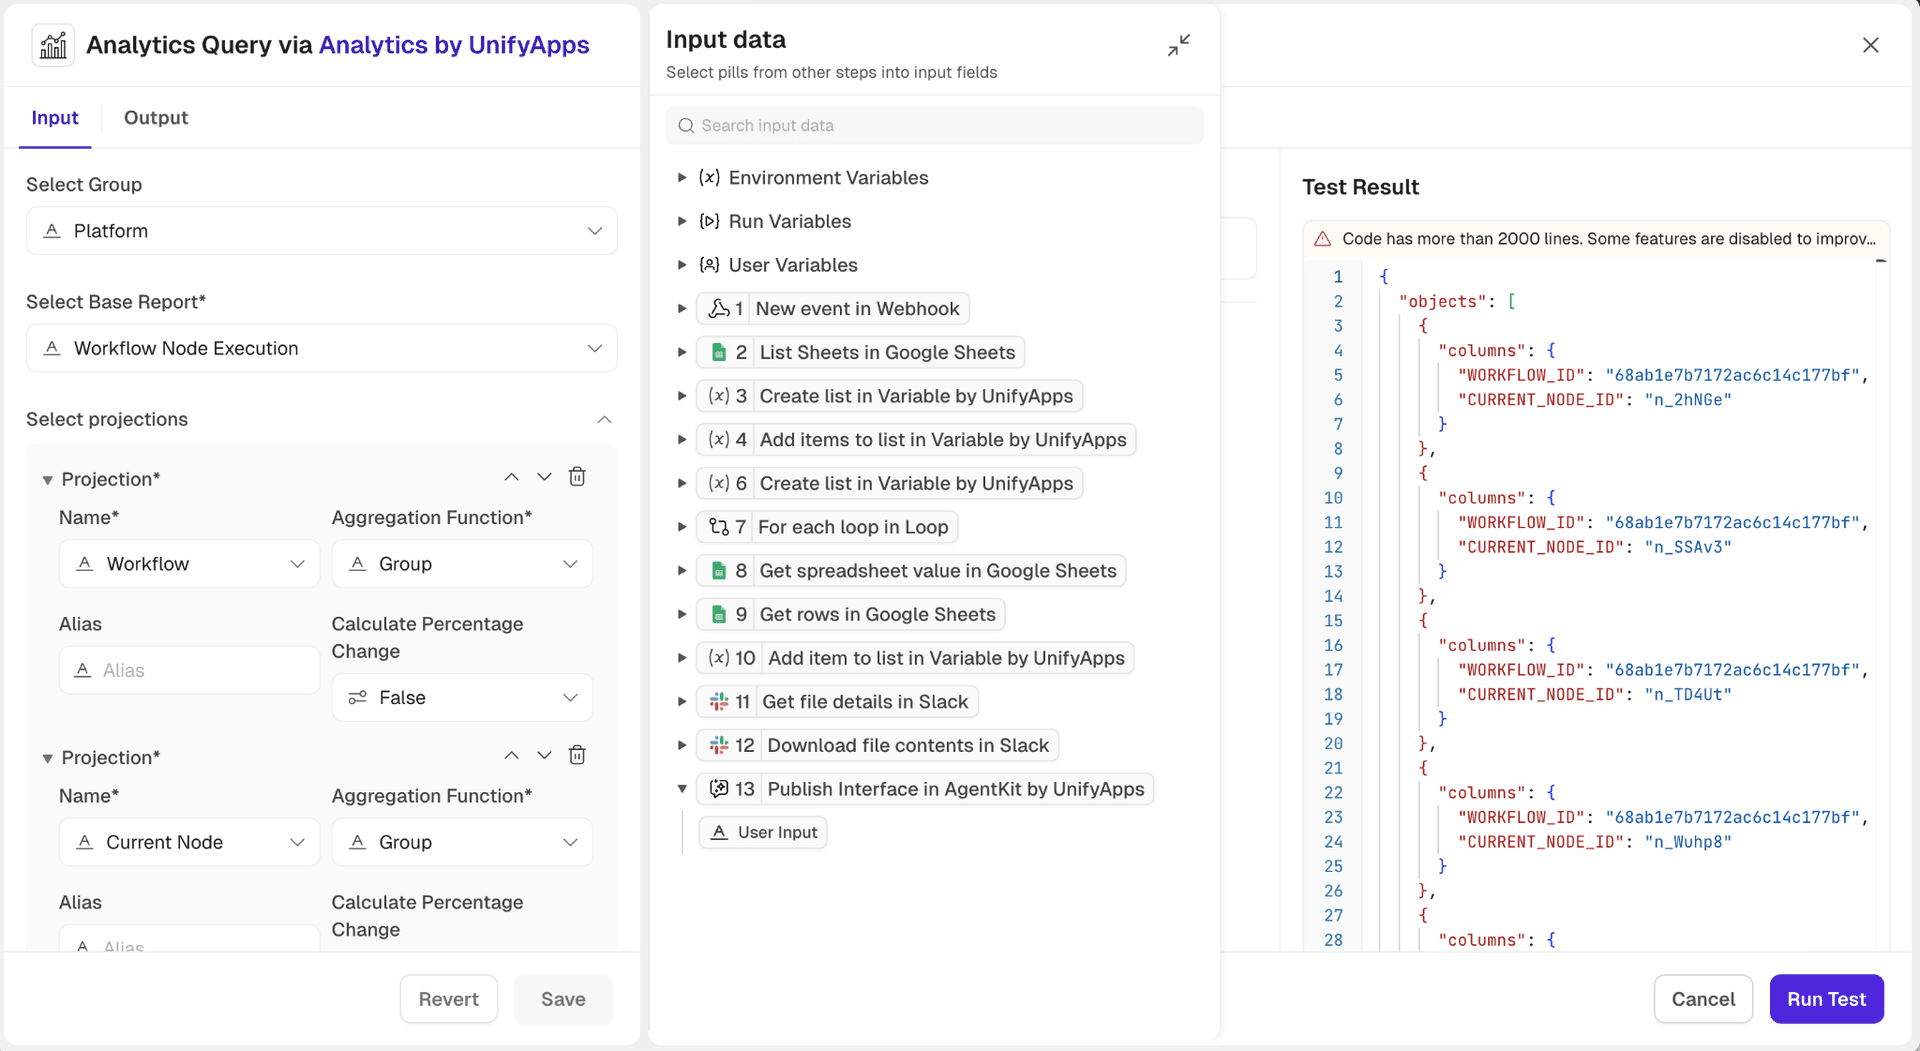
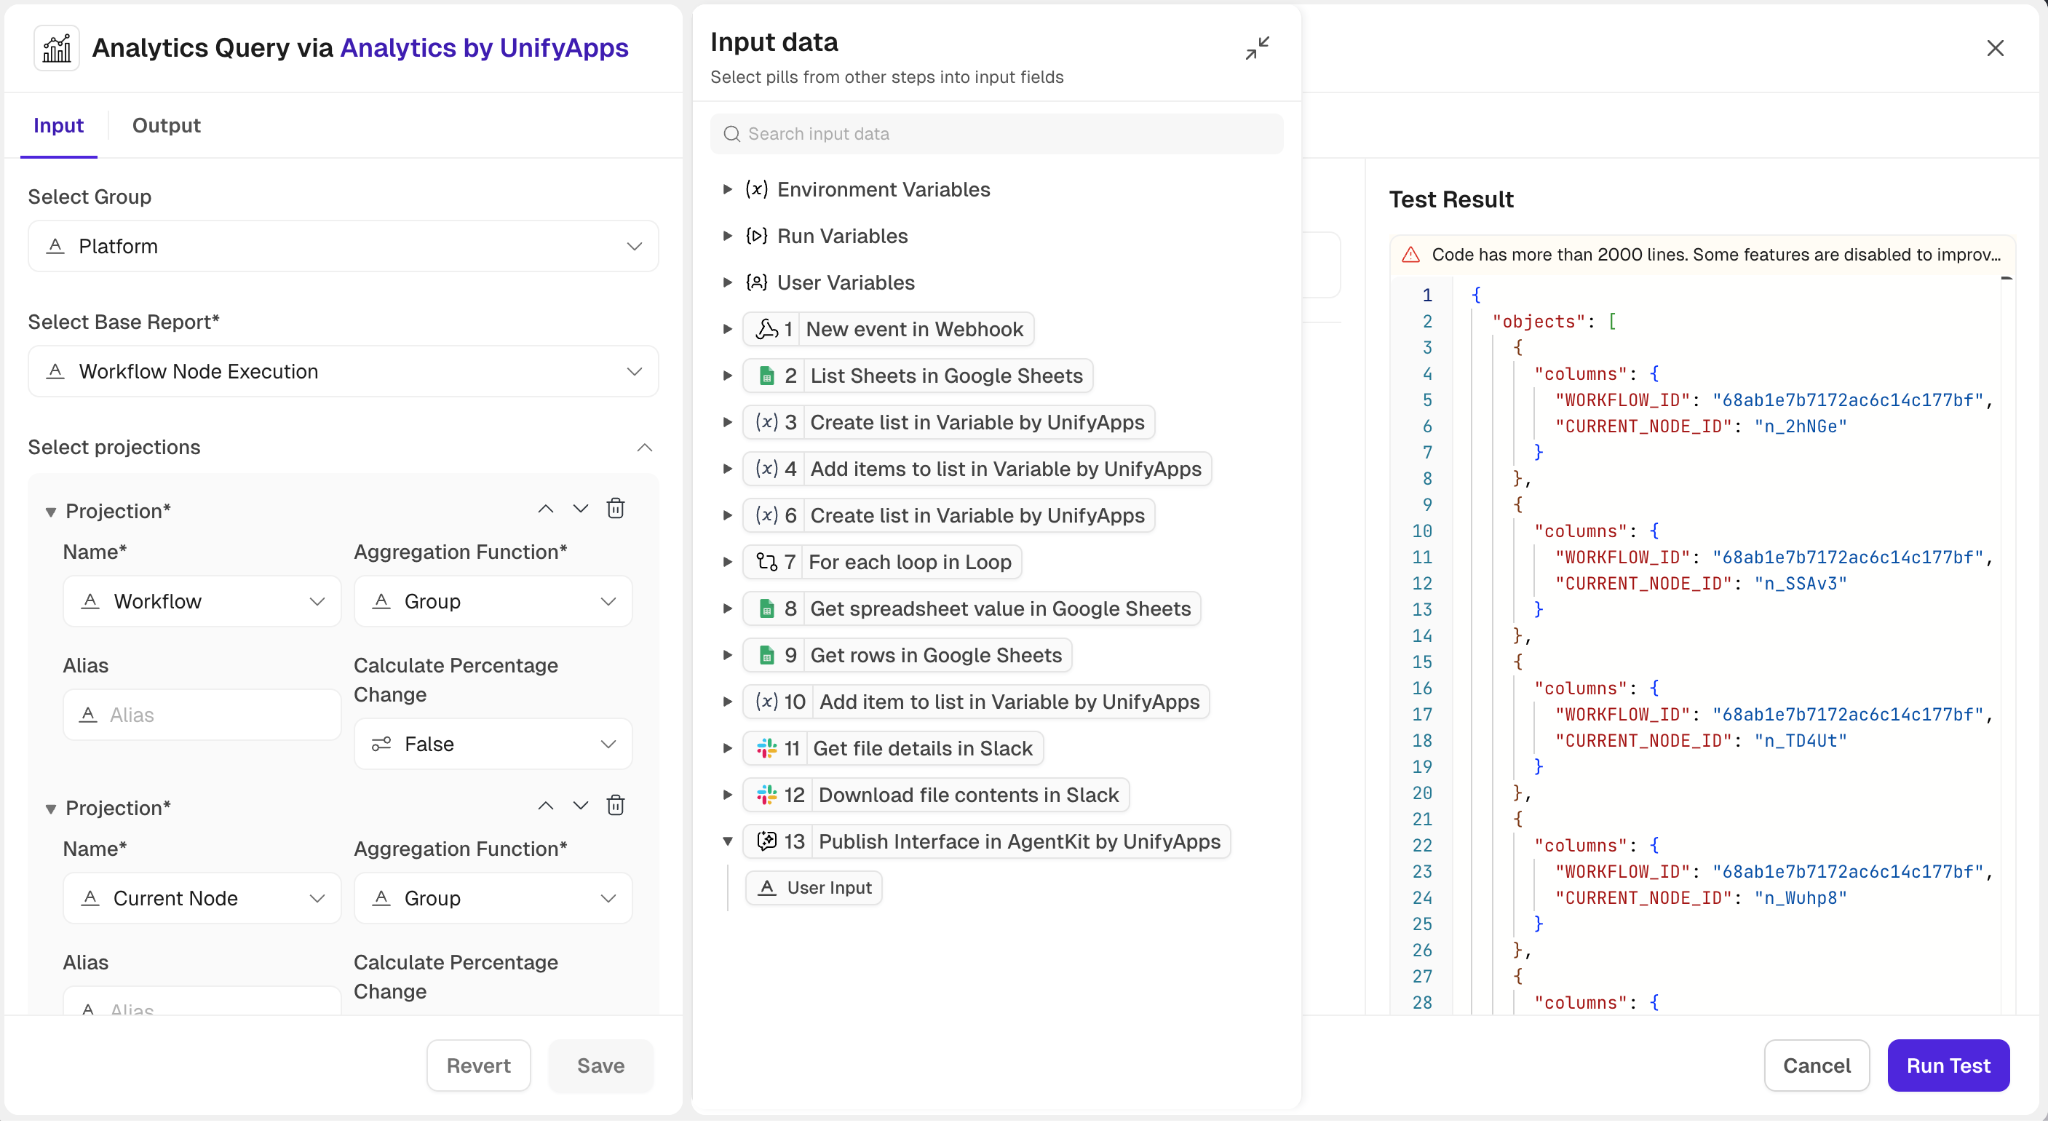
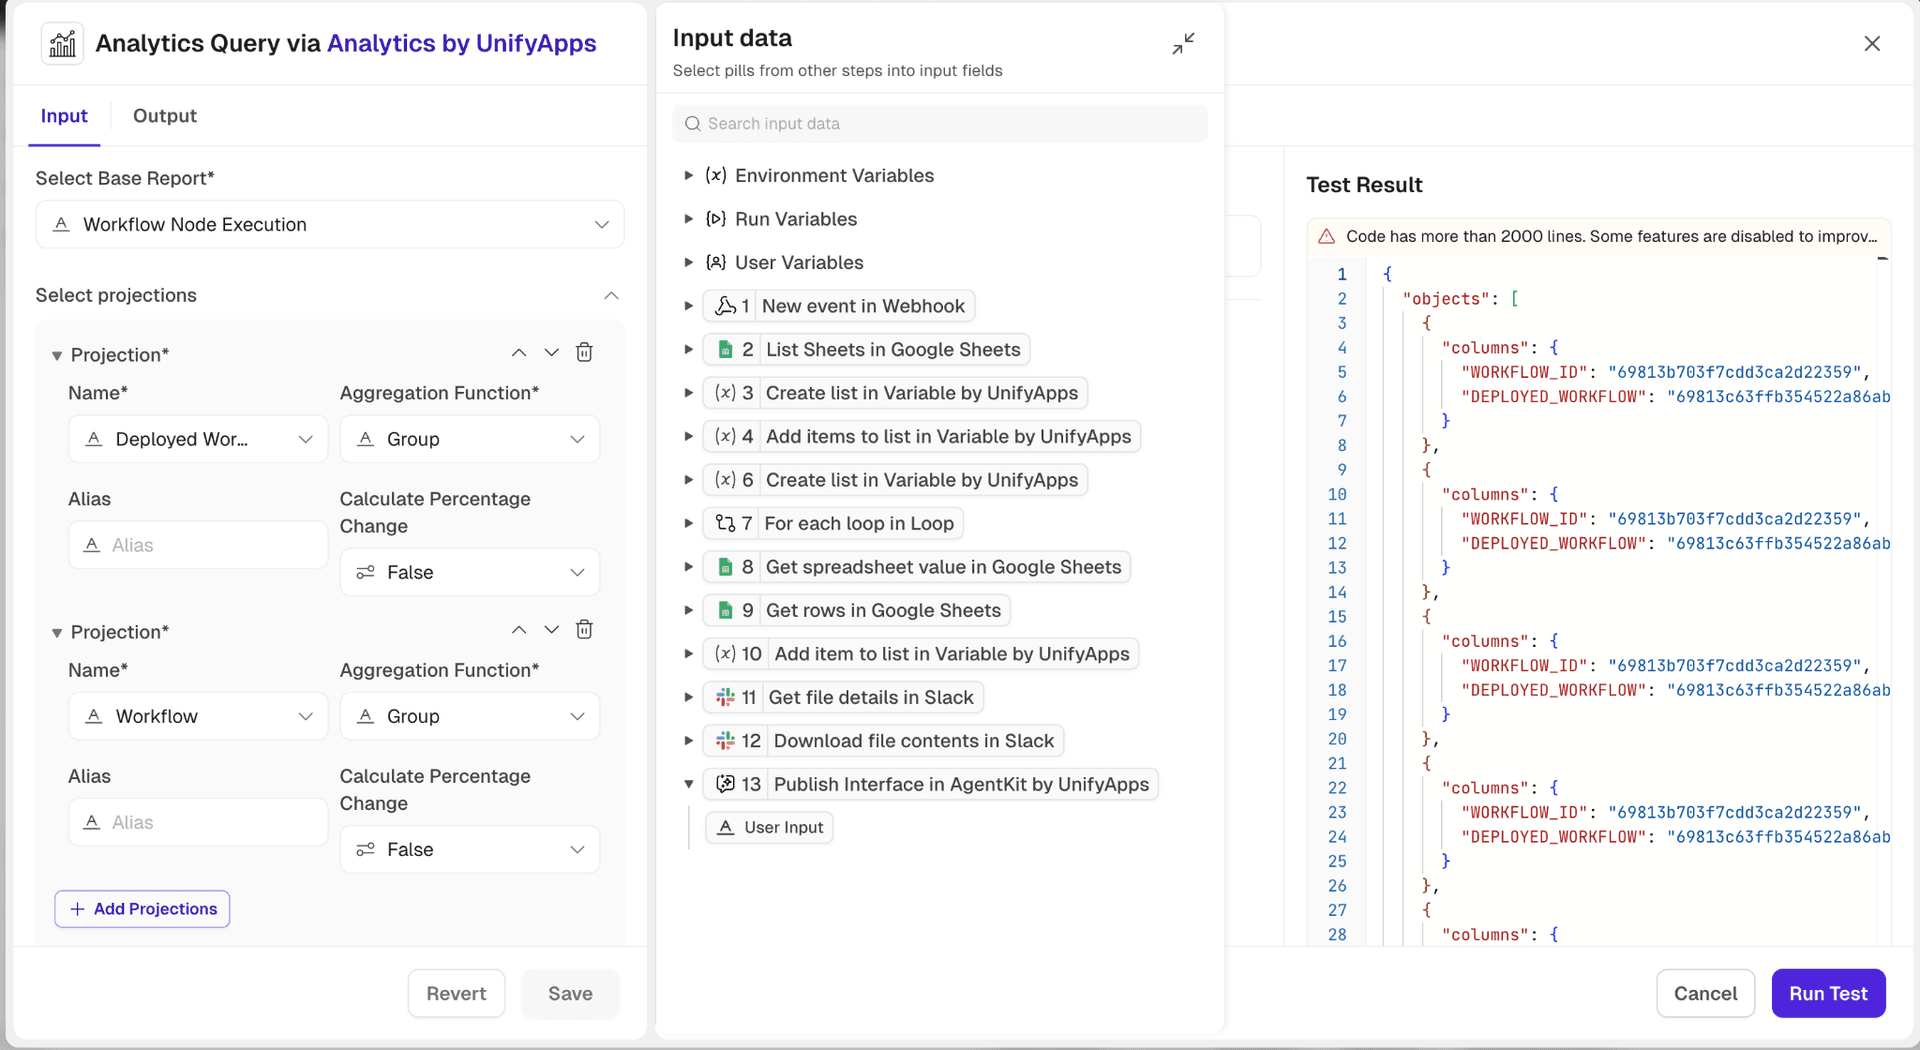
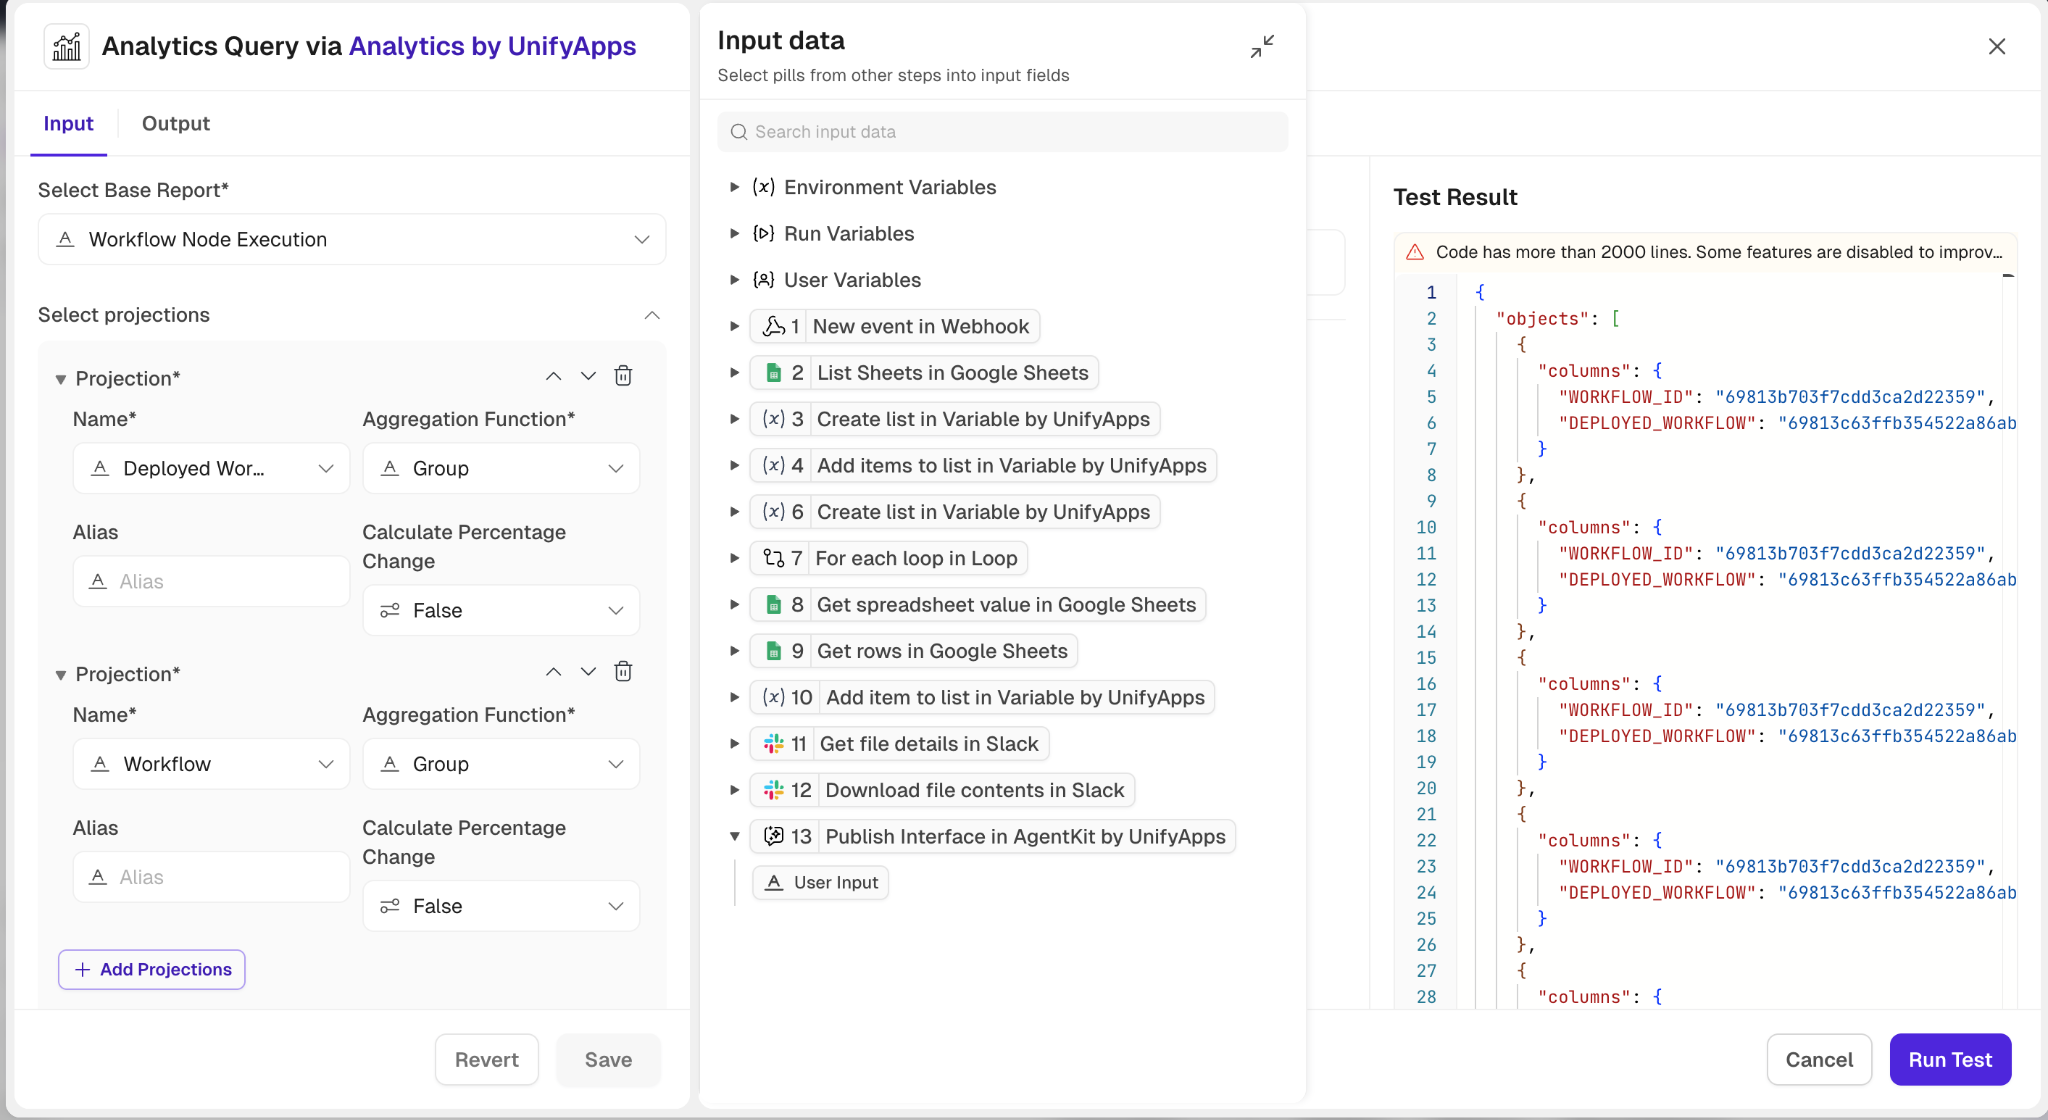
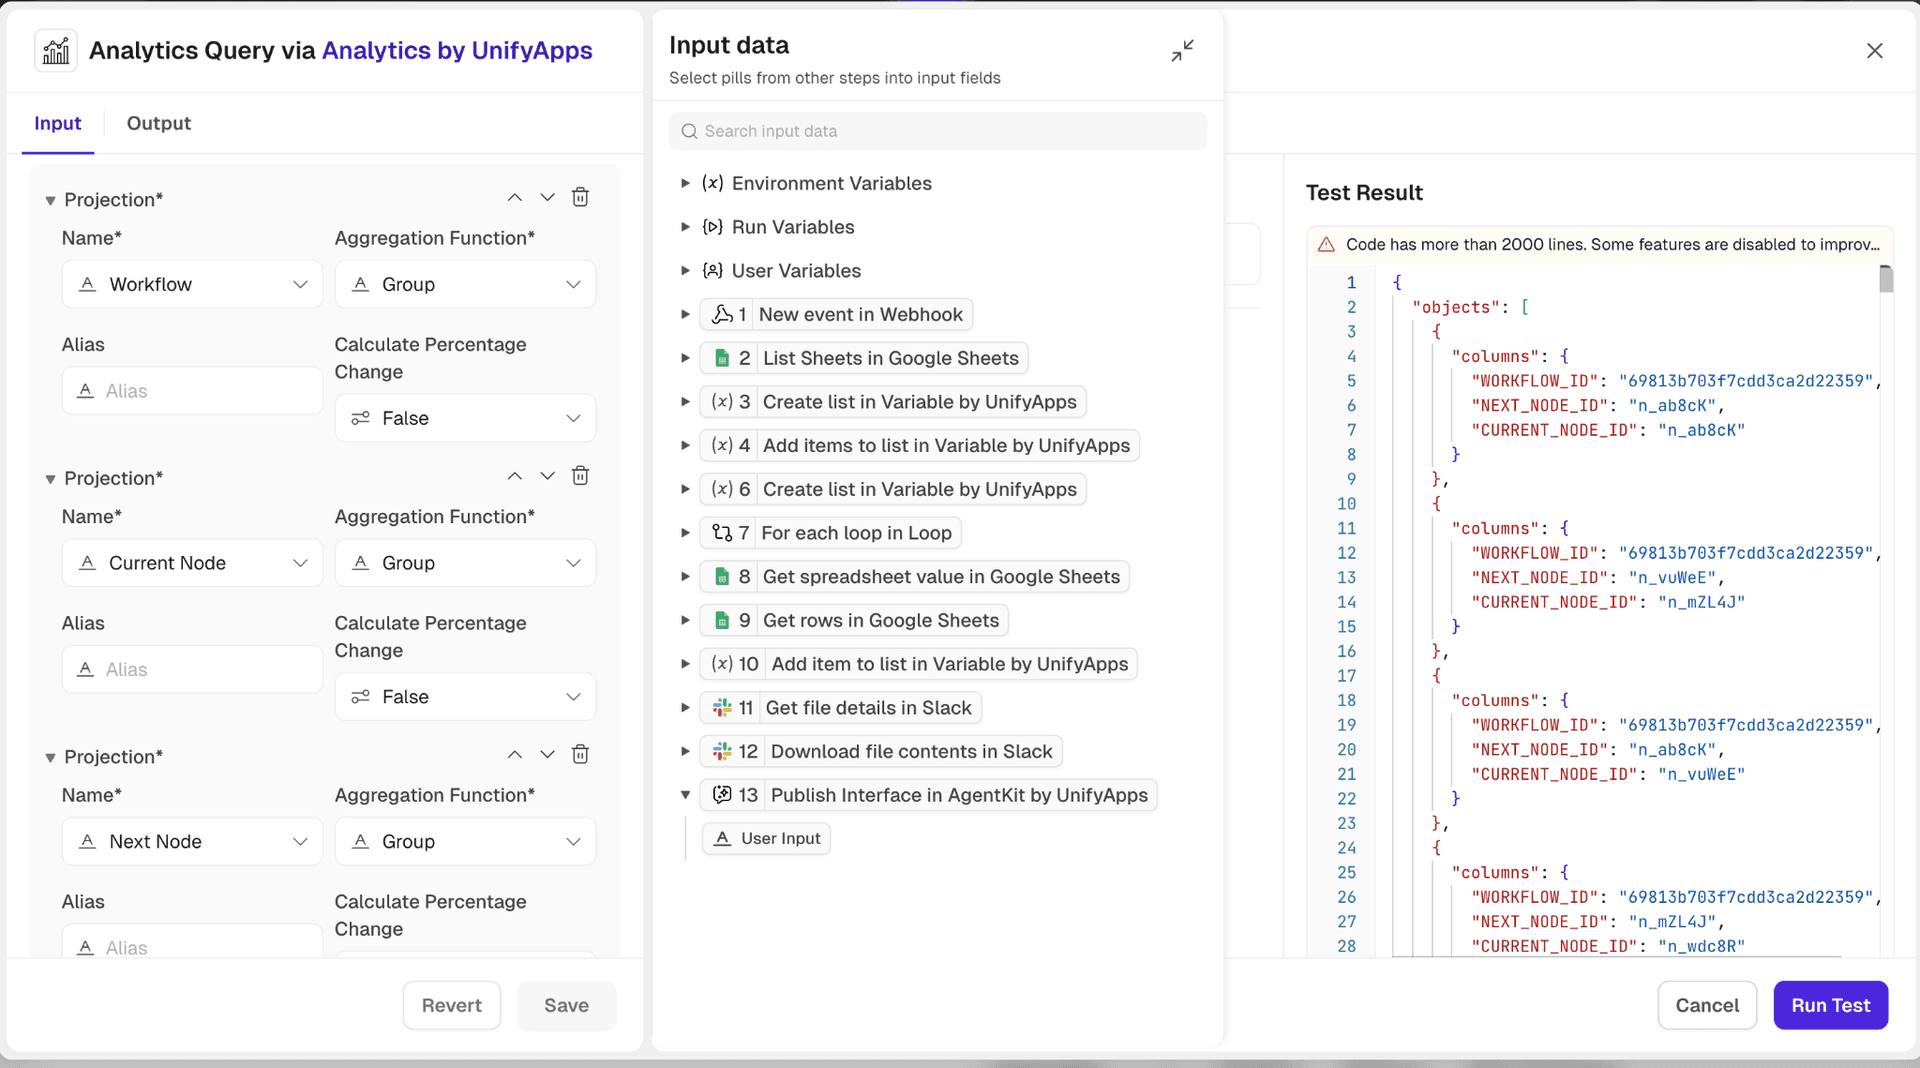
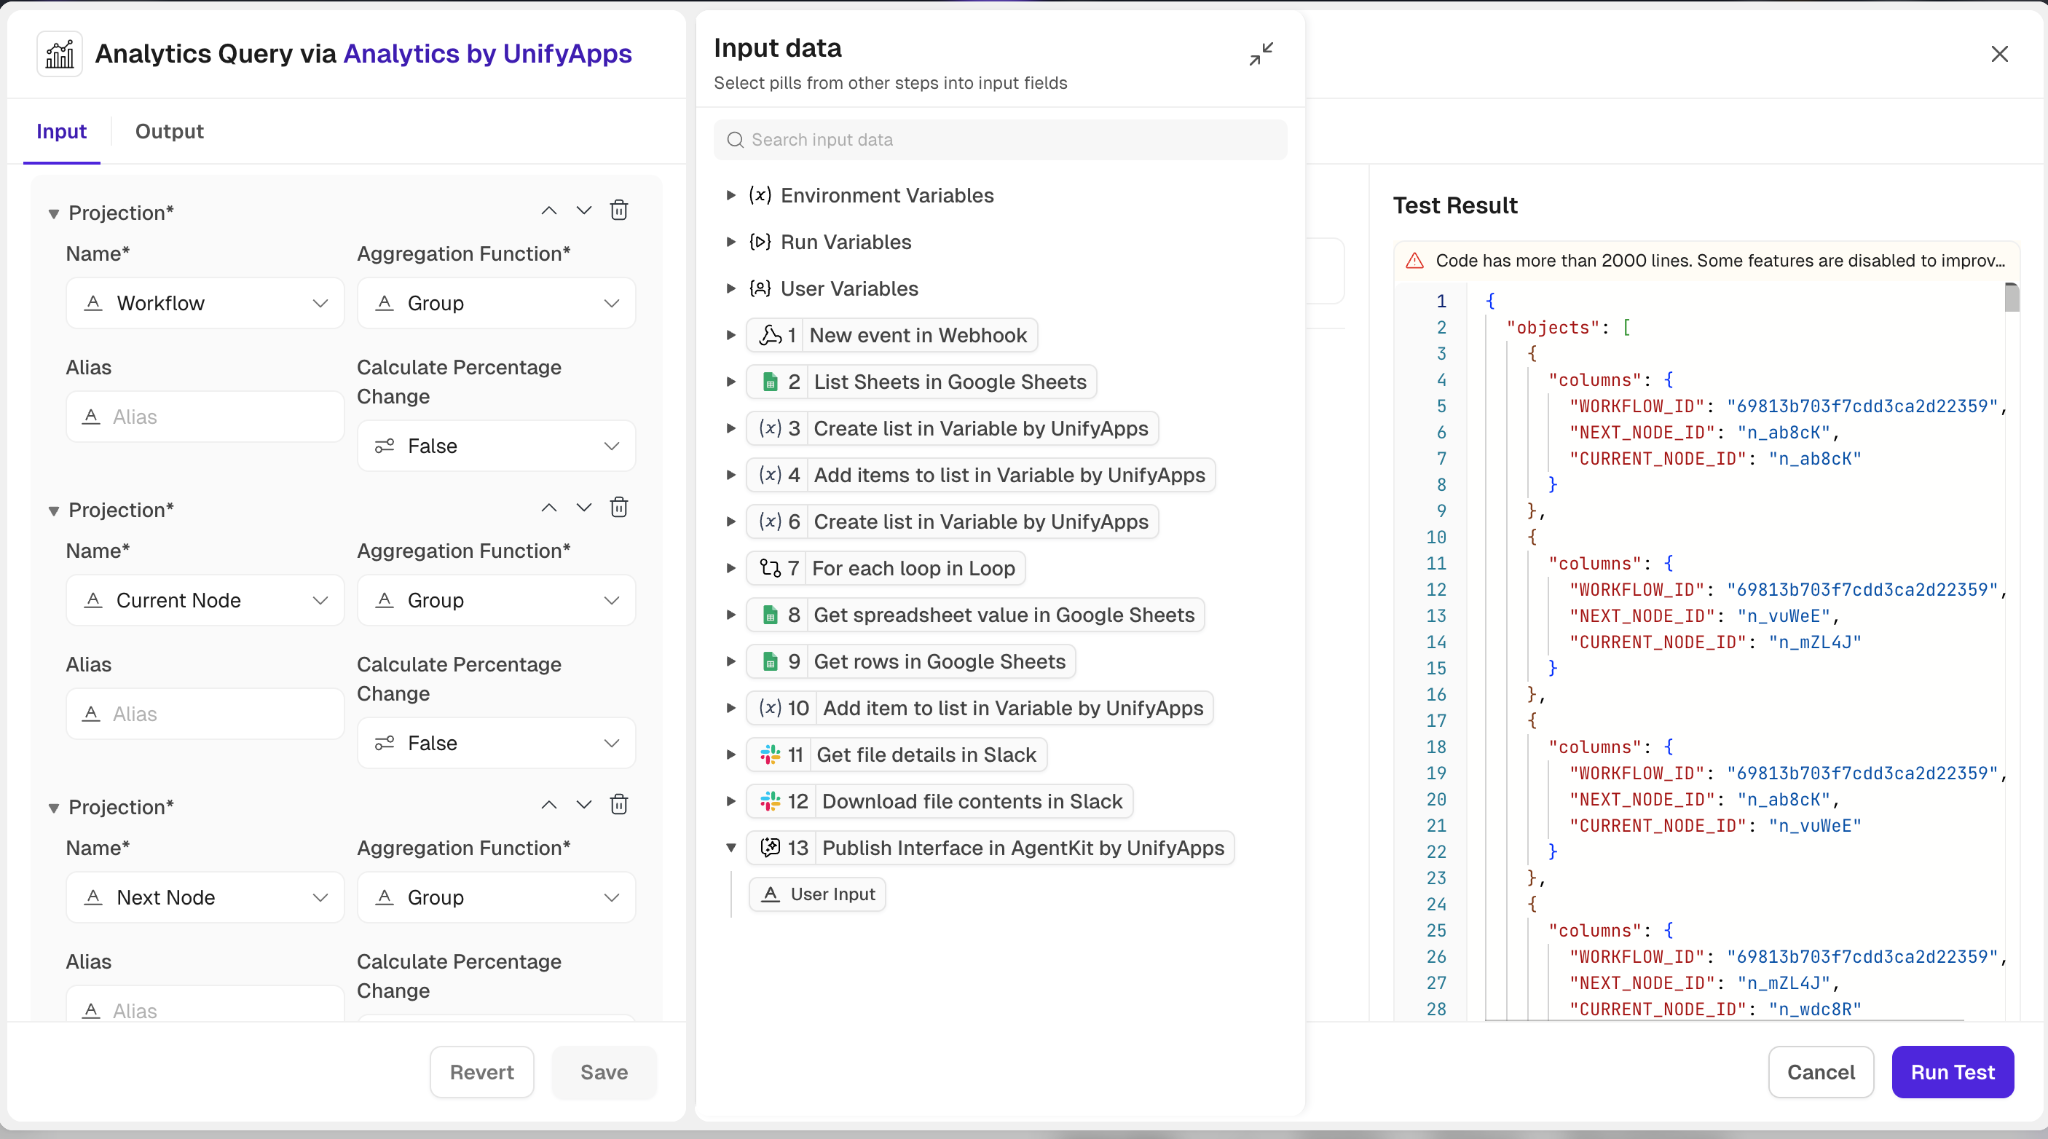
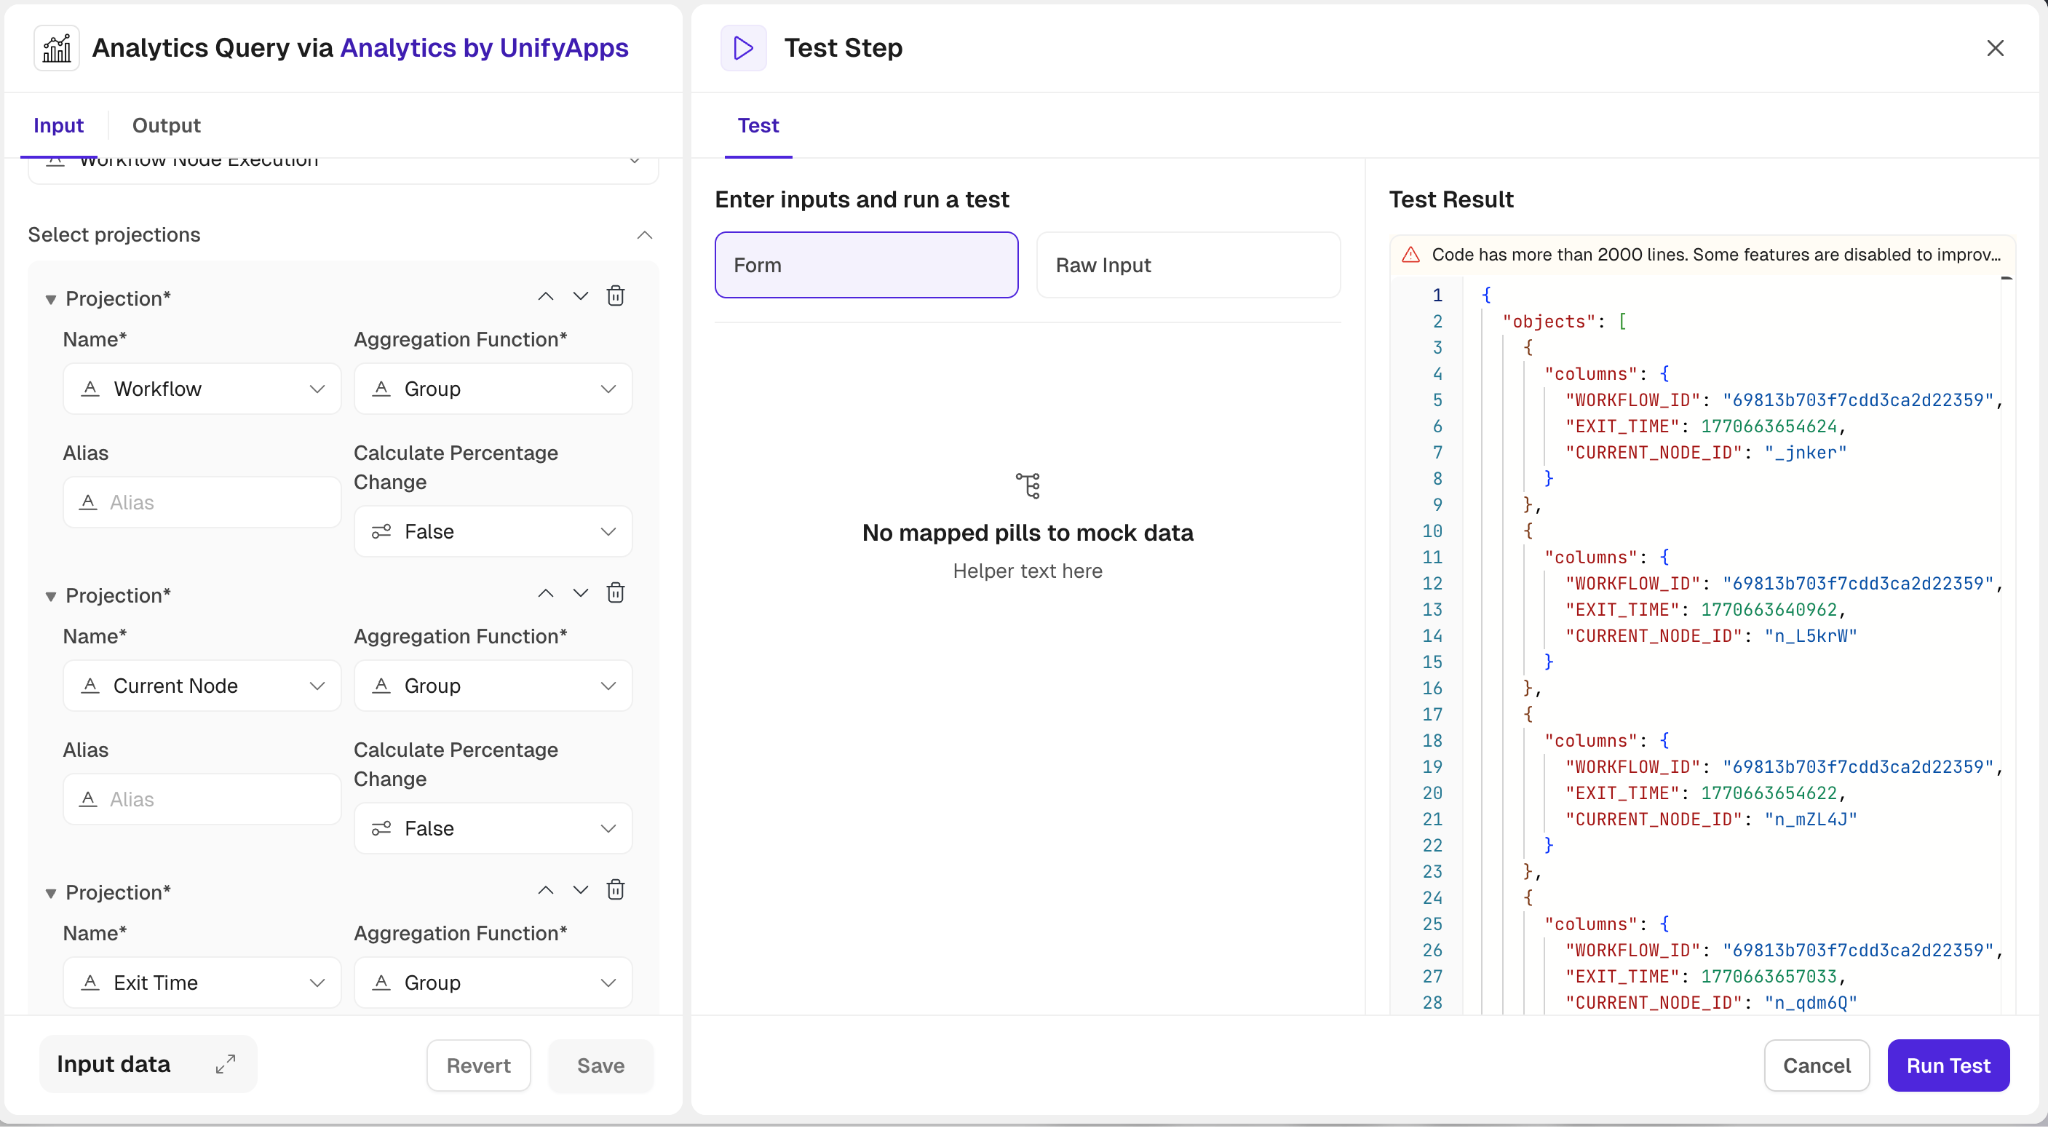
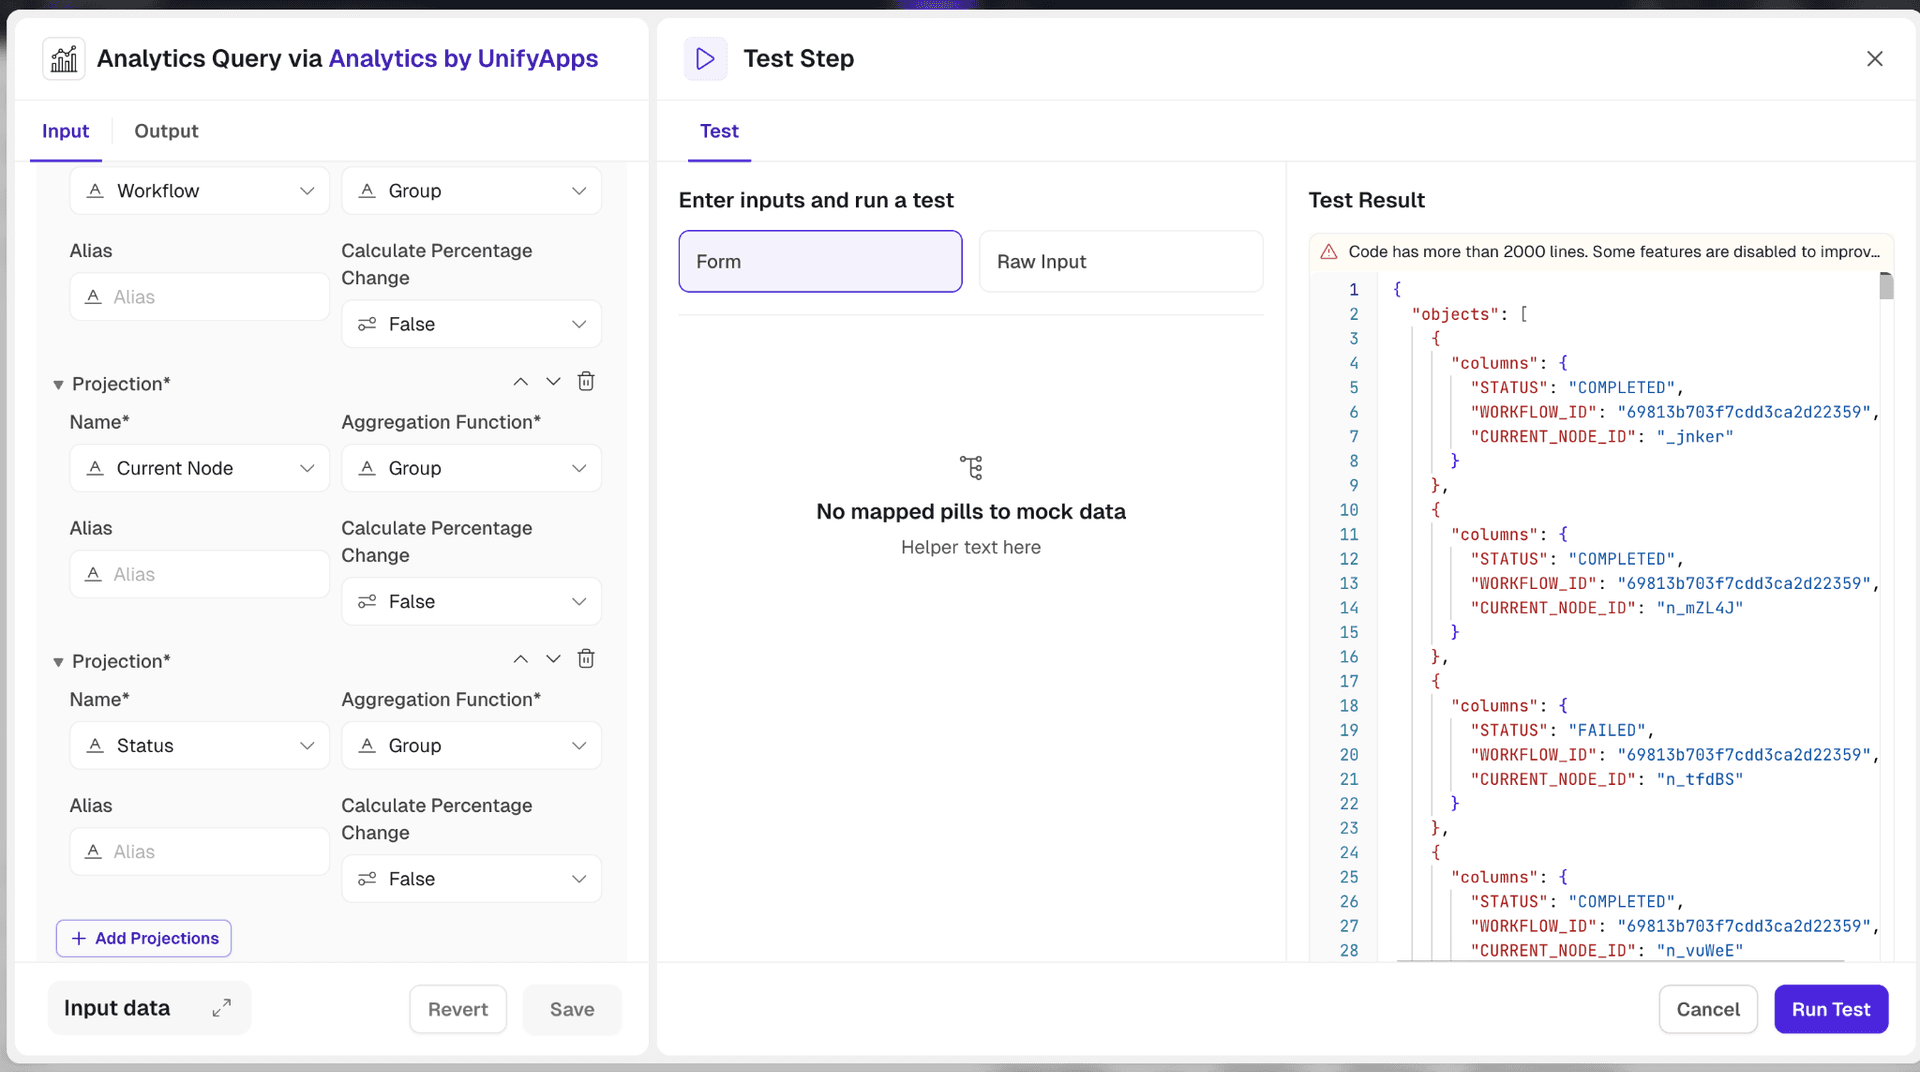
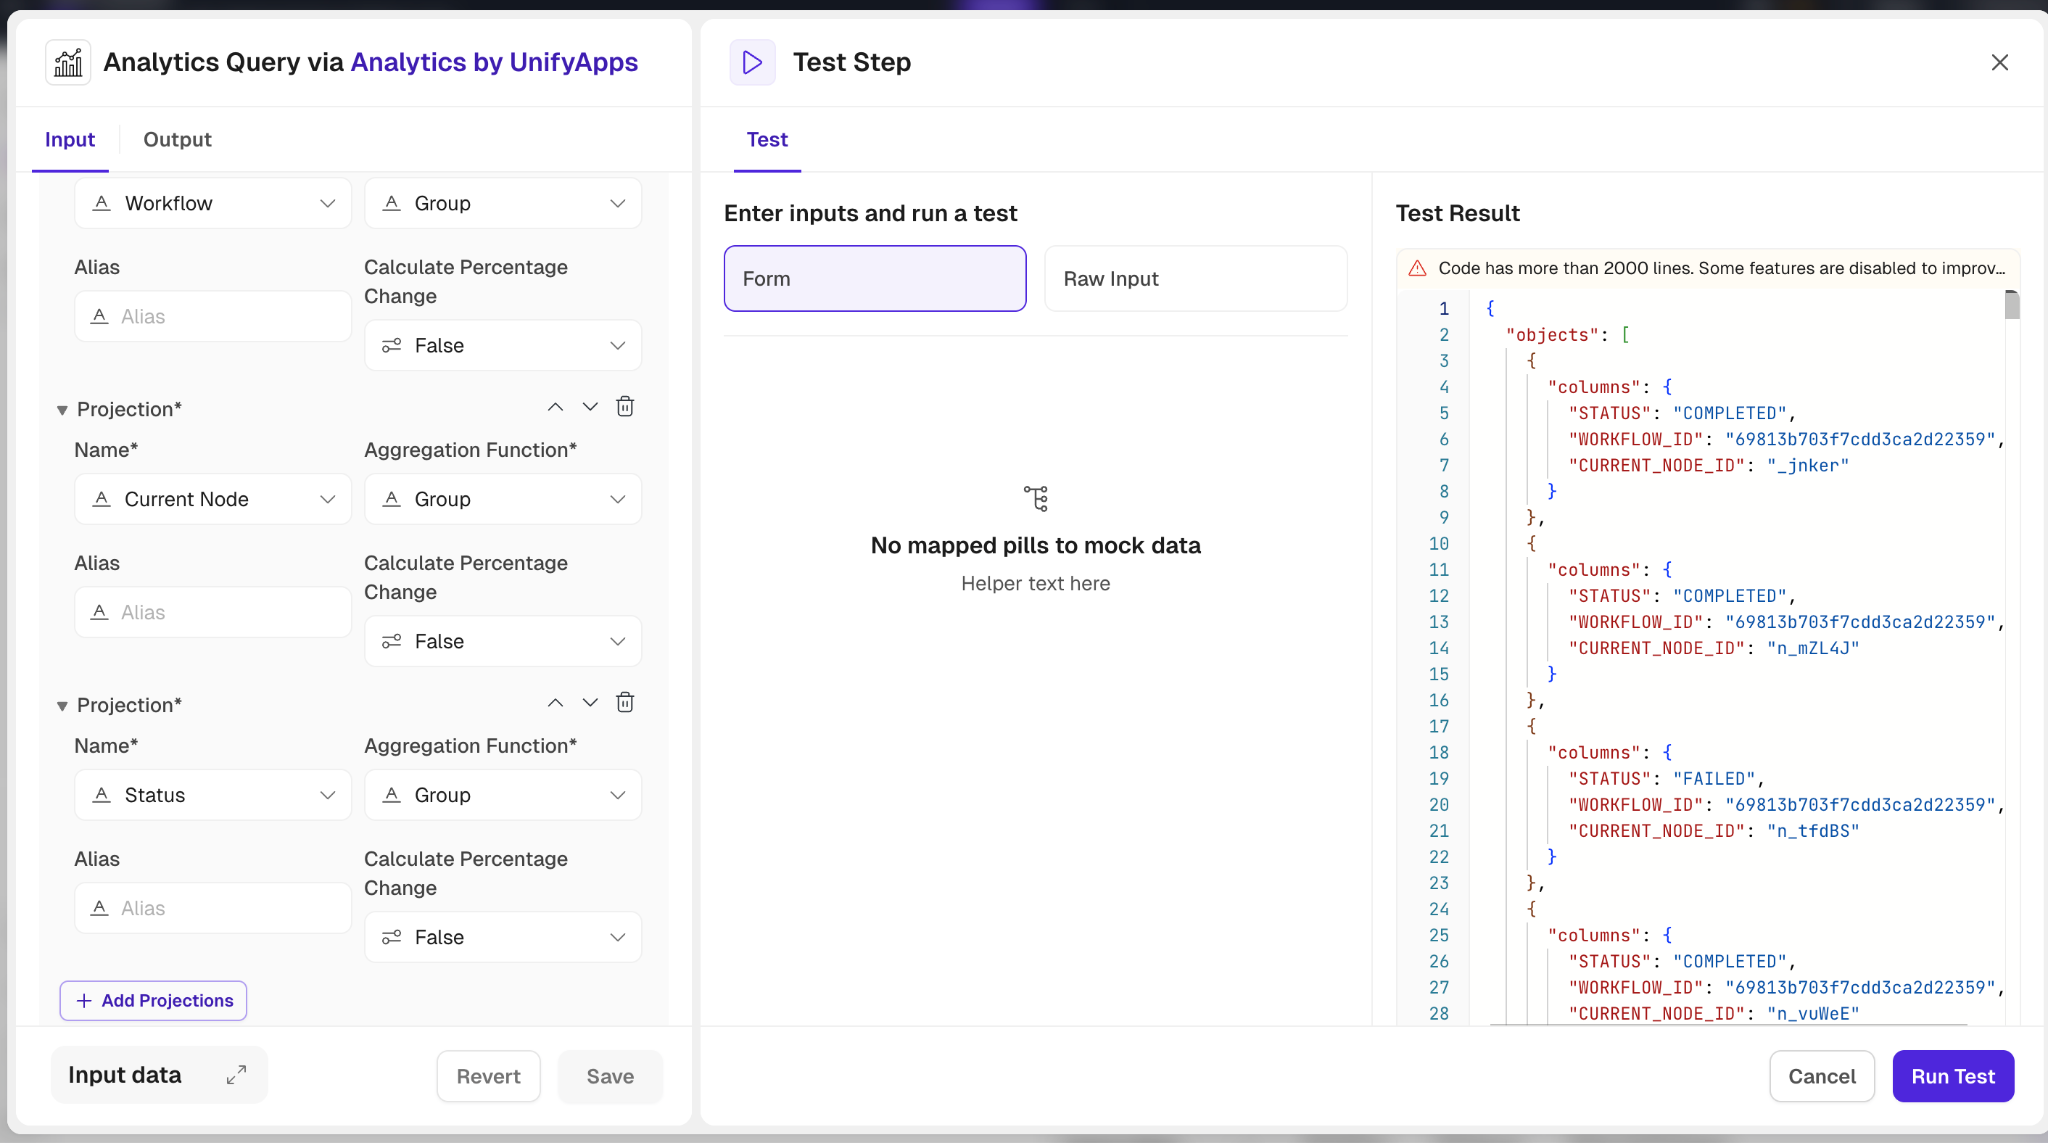
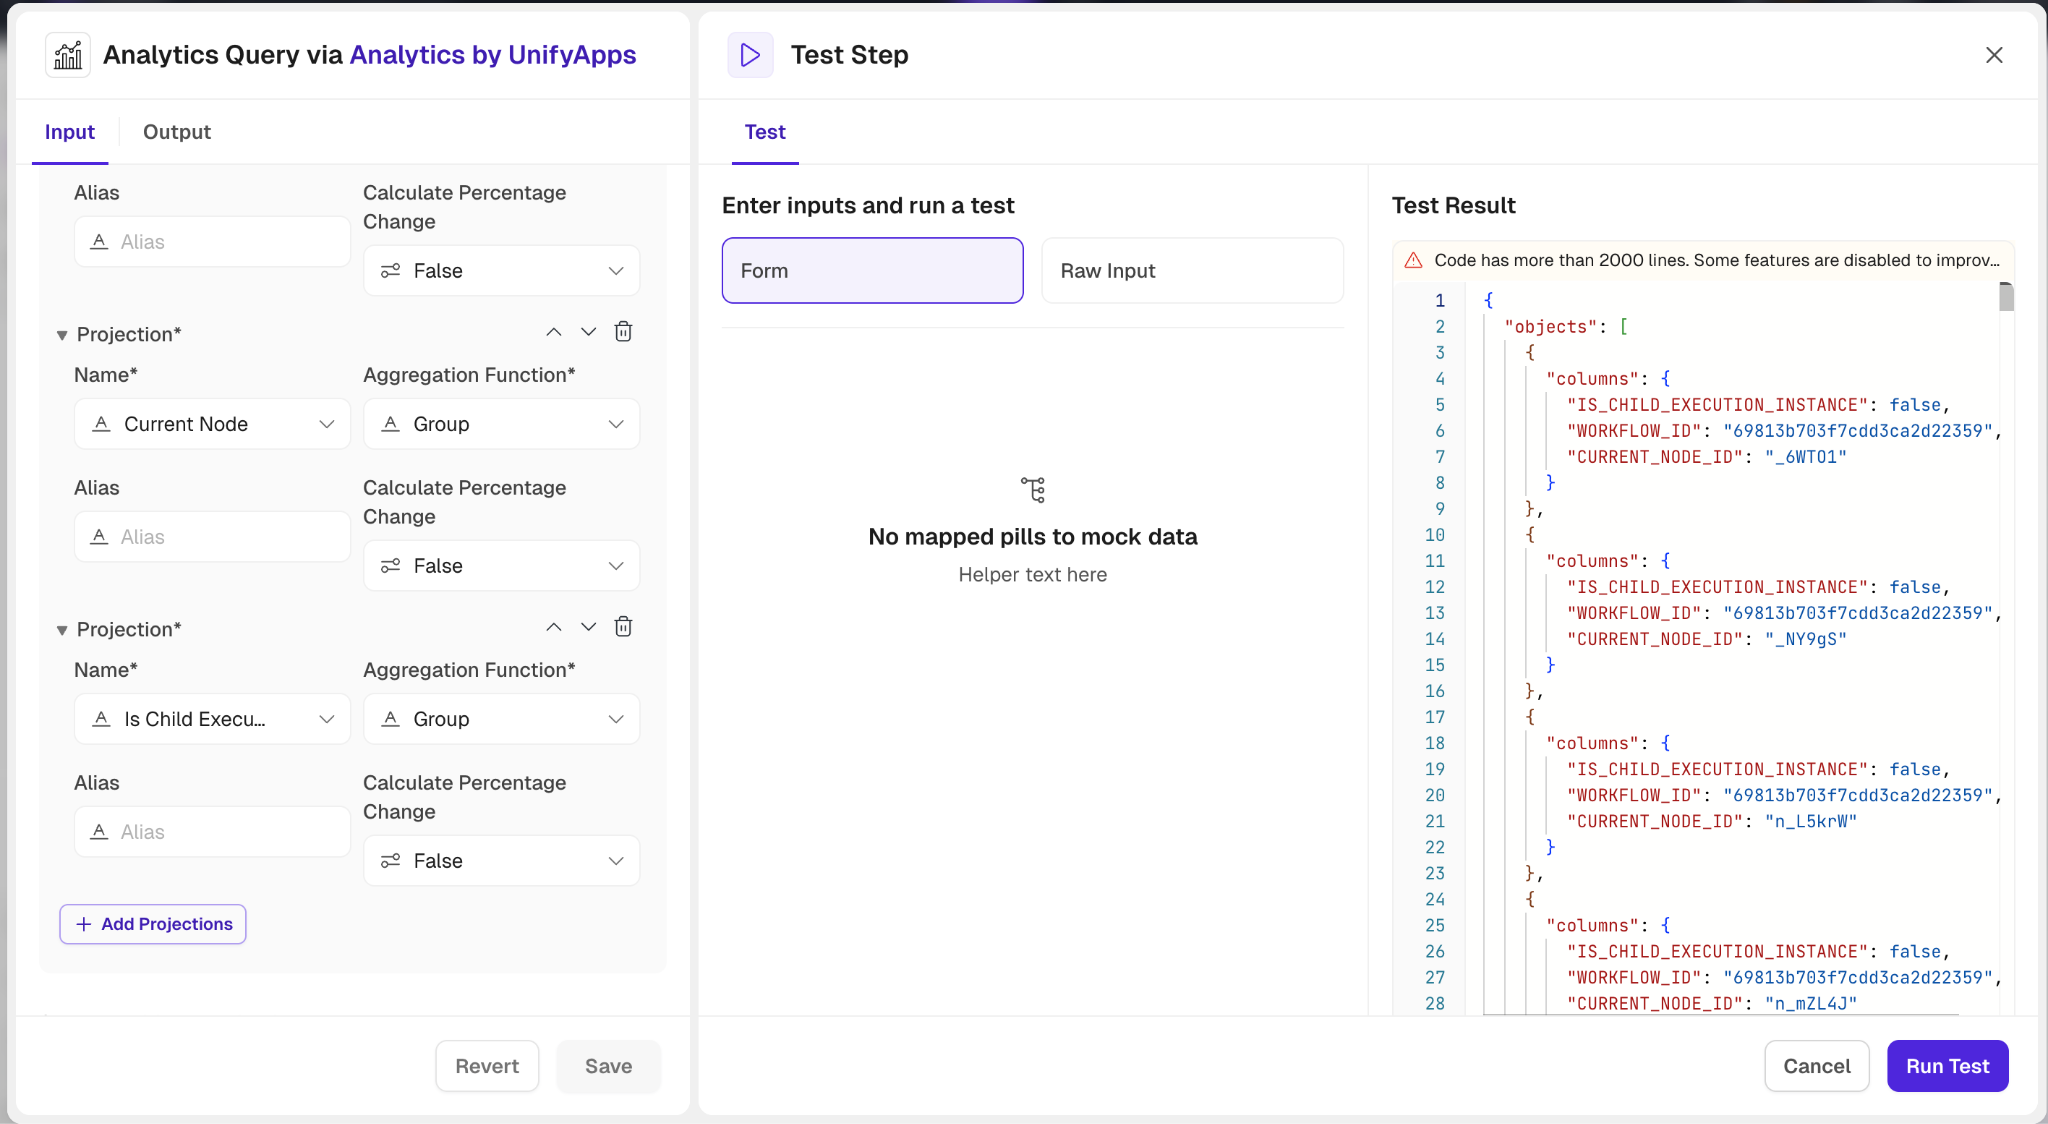
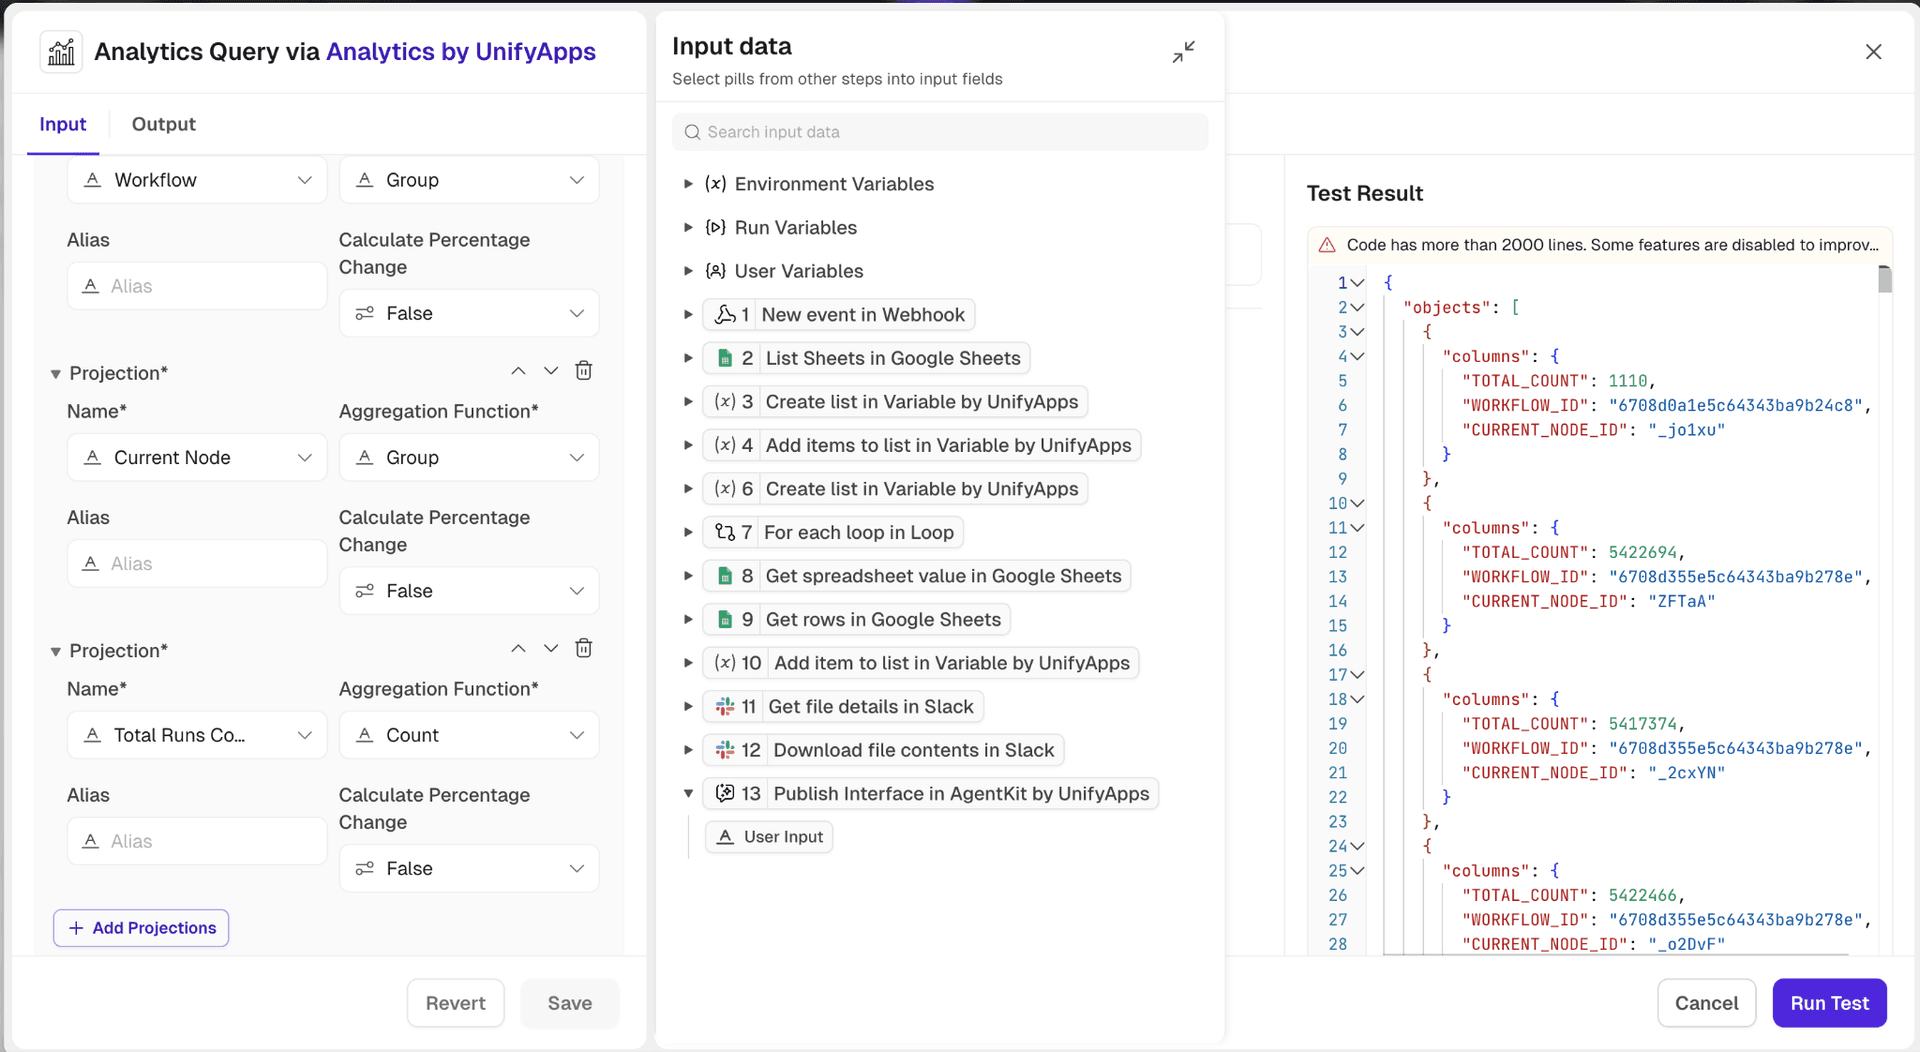
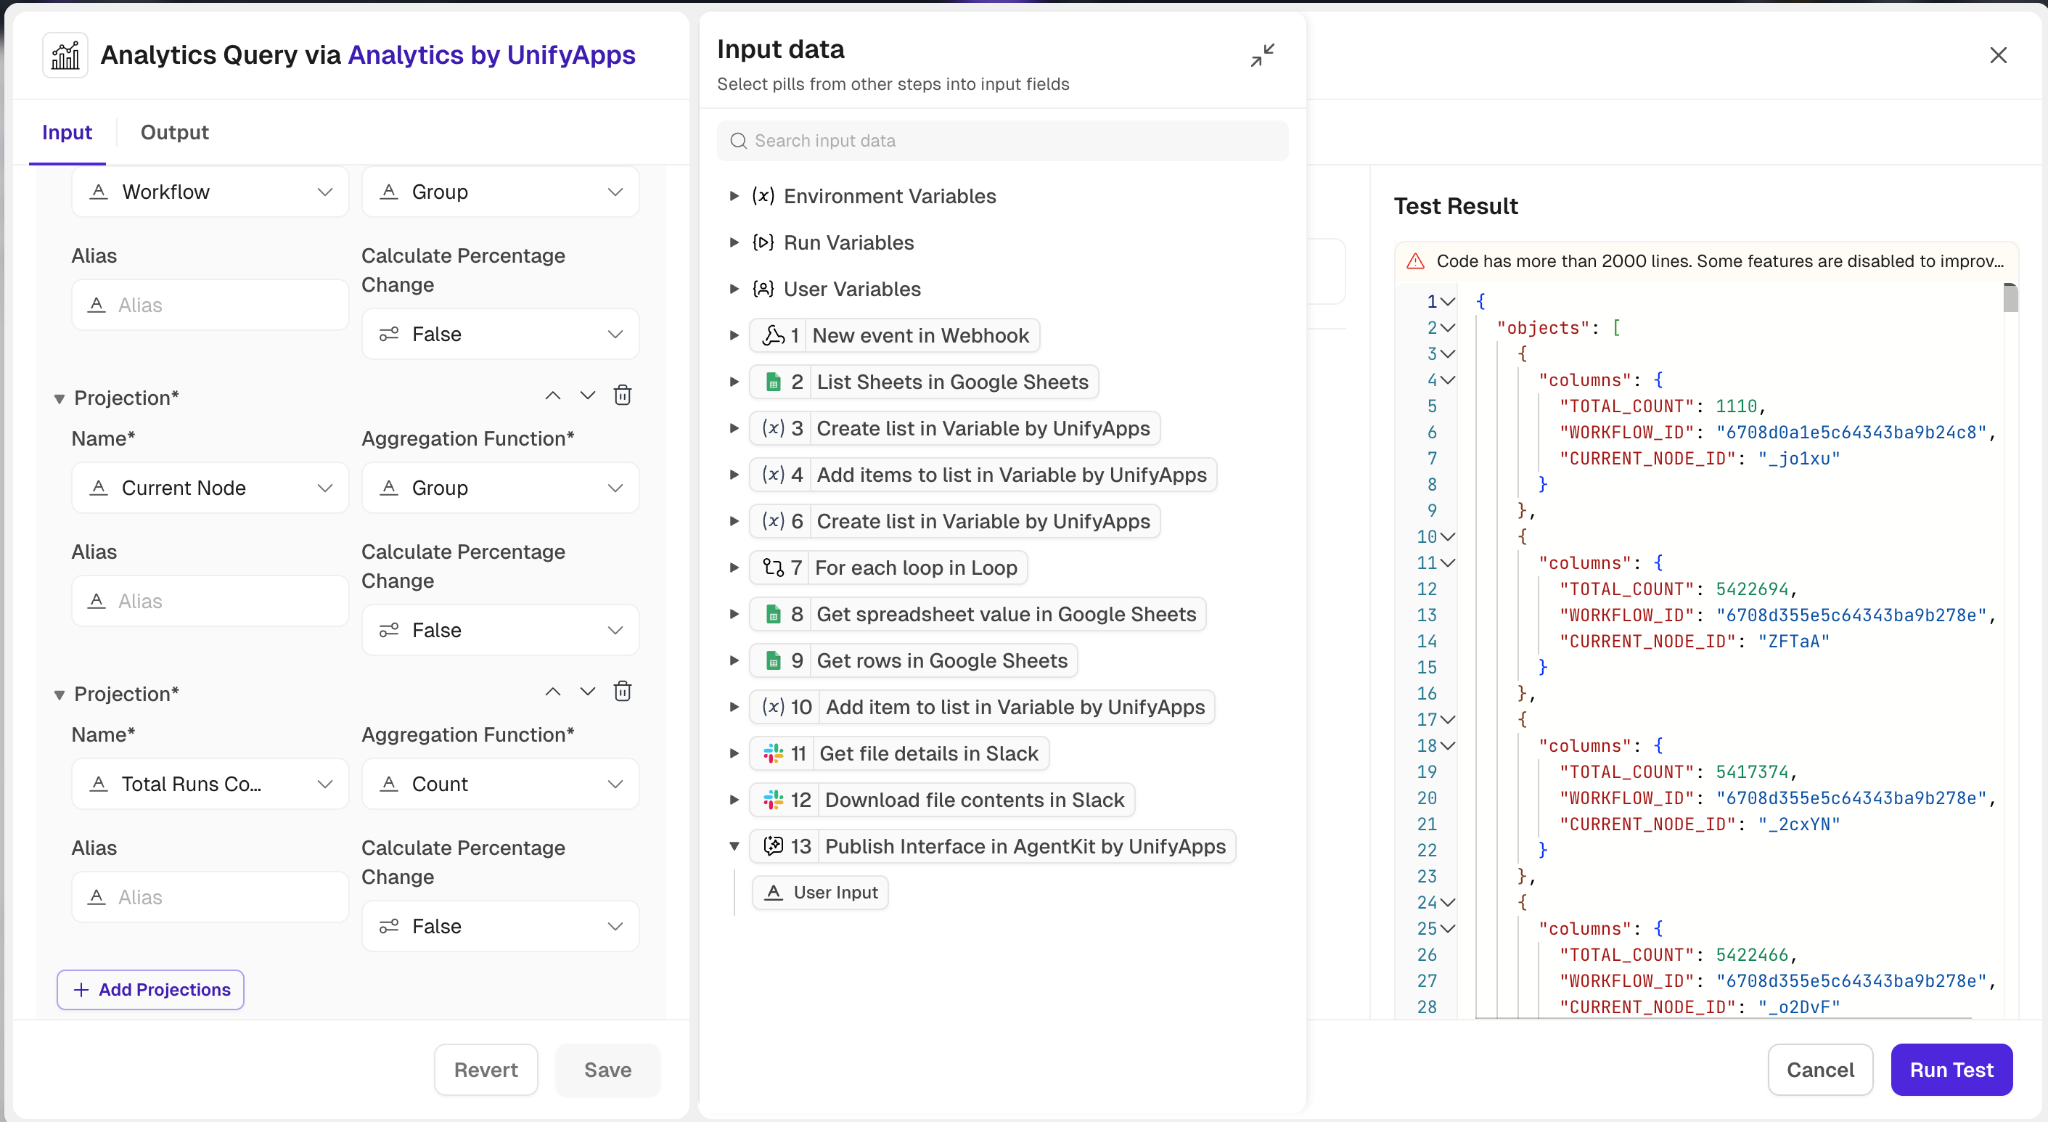
The Analytics Query action in Analytics by UnifyApps enables users to fetch, process, and analyze data from a selected base report. This action provides powerful querying capabilities, including grouping, filtering, and projecting data, along with aggregation and percentage-based calculations.
Input Requirements:
Select Group: Choose between Platform or Storage to define the data grouping.Select Base Report: Choose the base report object.Select Projections:
Choose fields and apply aggregation functions like Count, Sum, Min/Max, Percentage Contribution, or even custom operations.
Assign aliases to projections for clarity.
Optionally, calculate percentage changes.
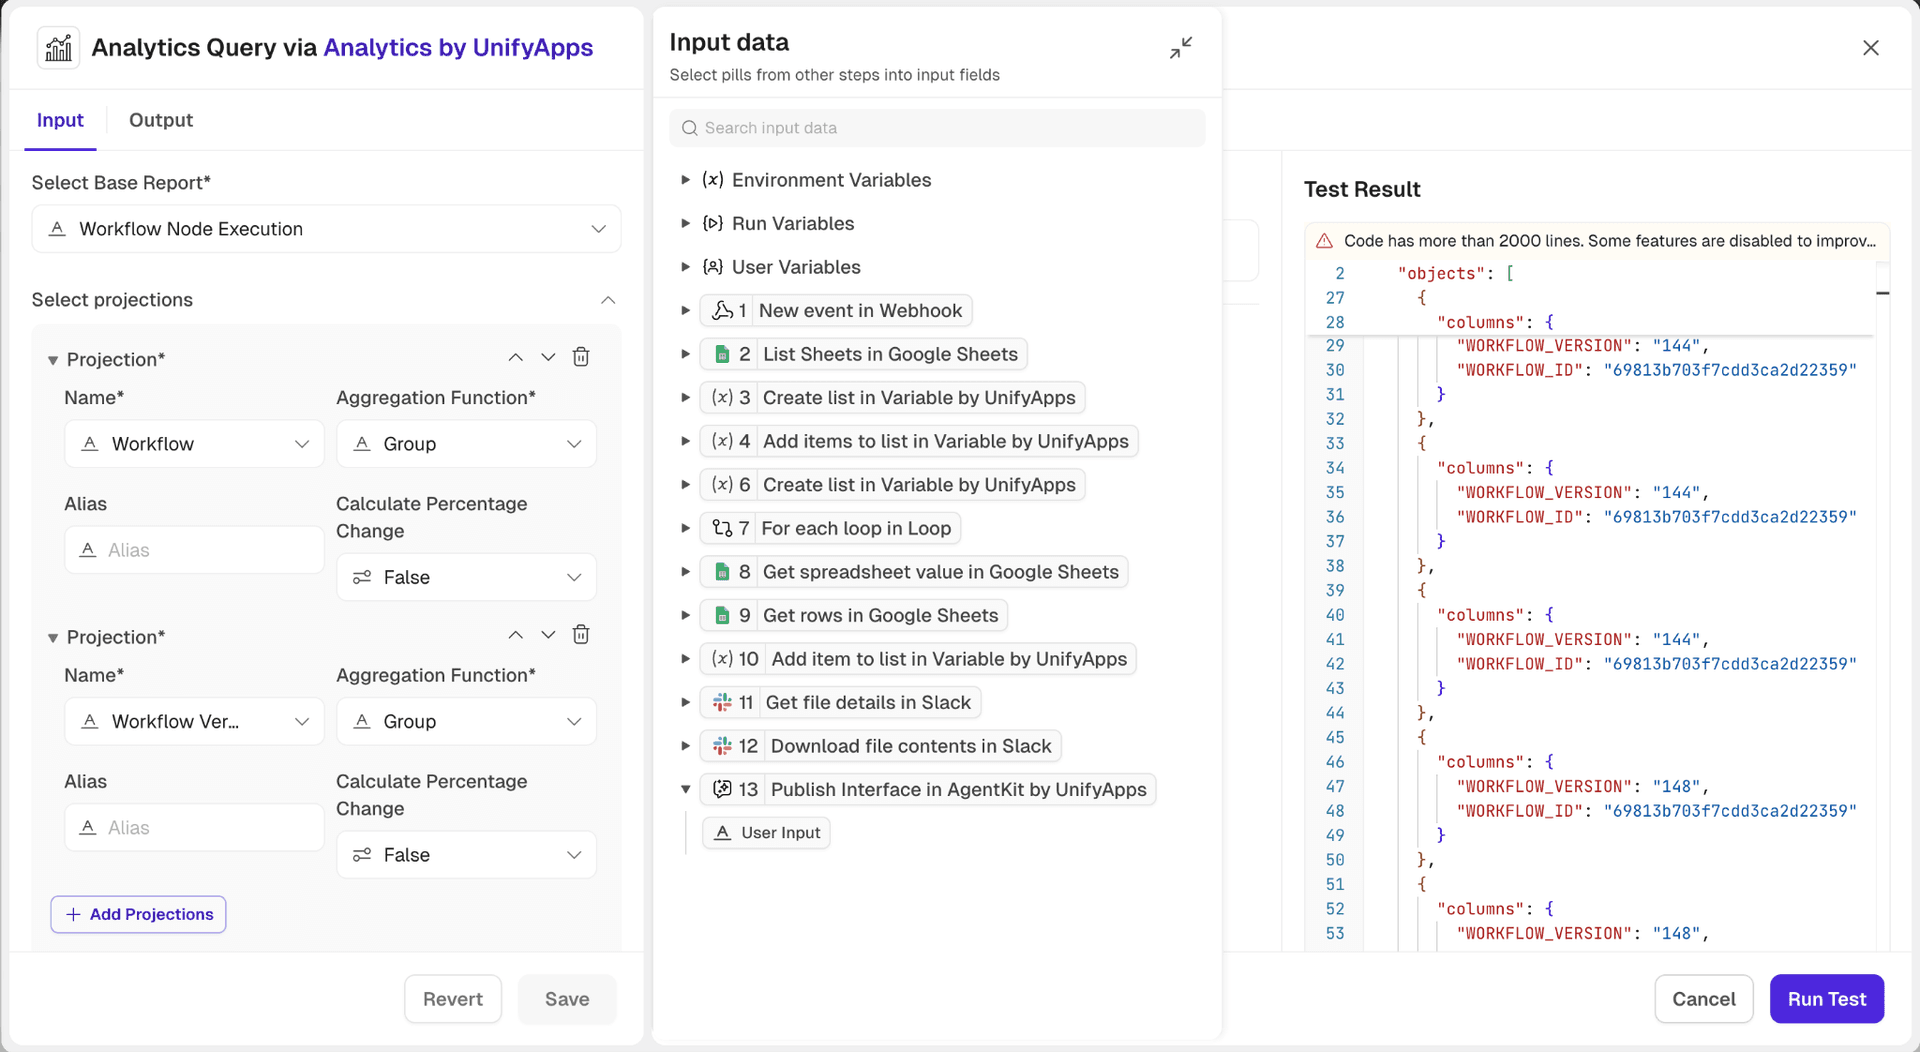
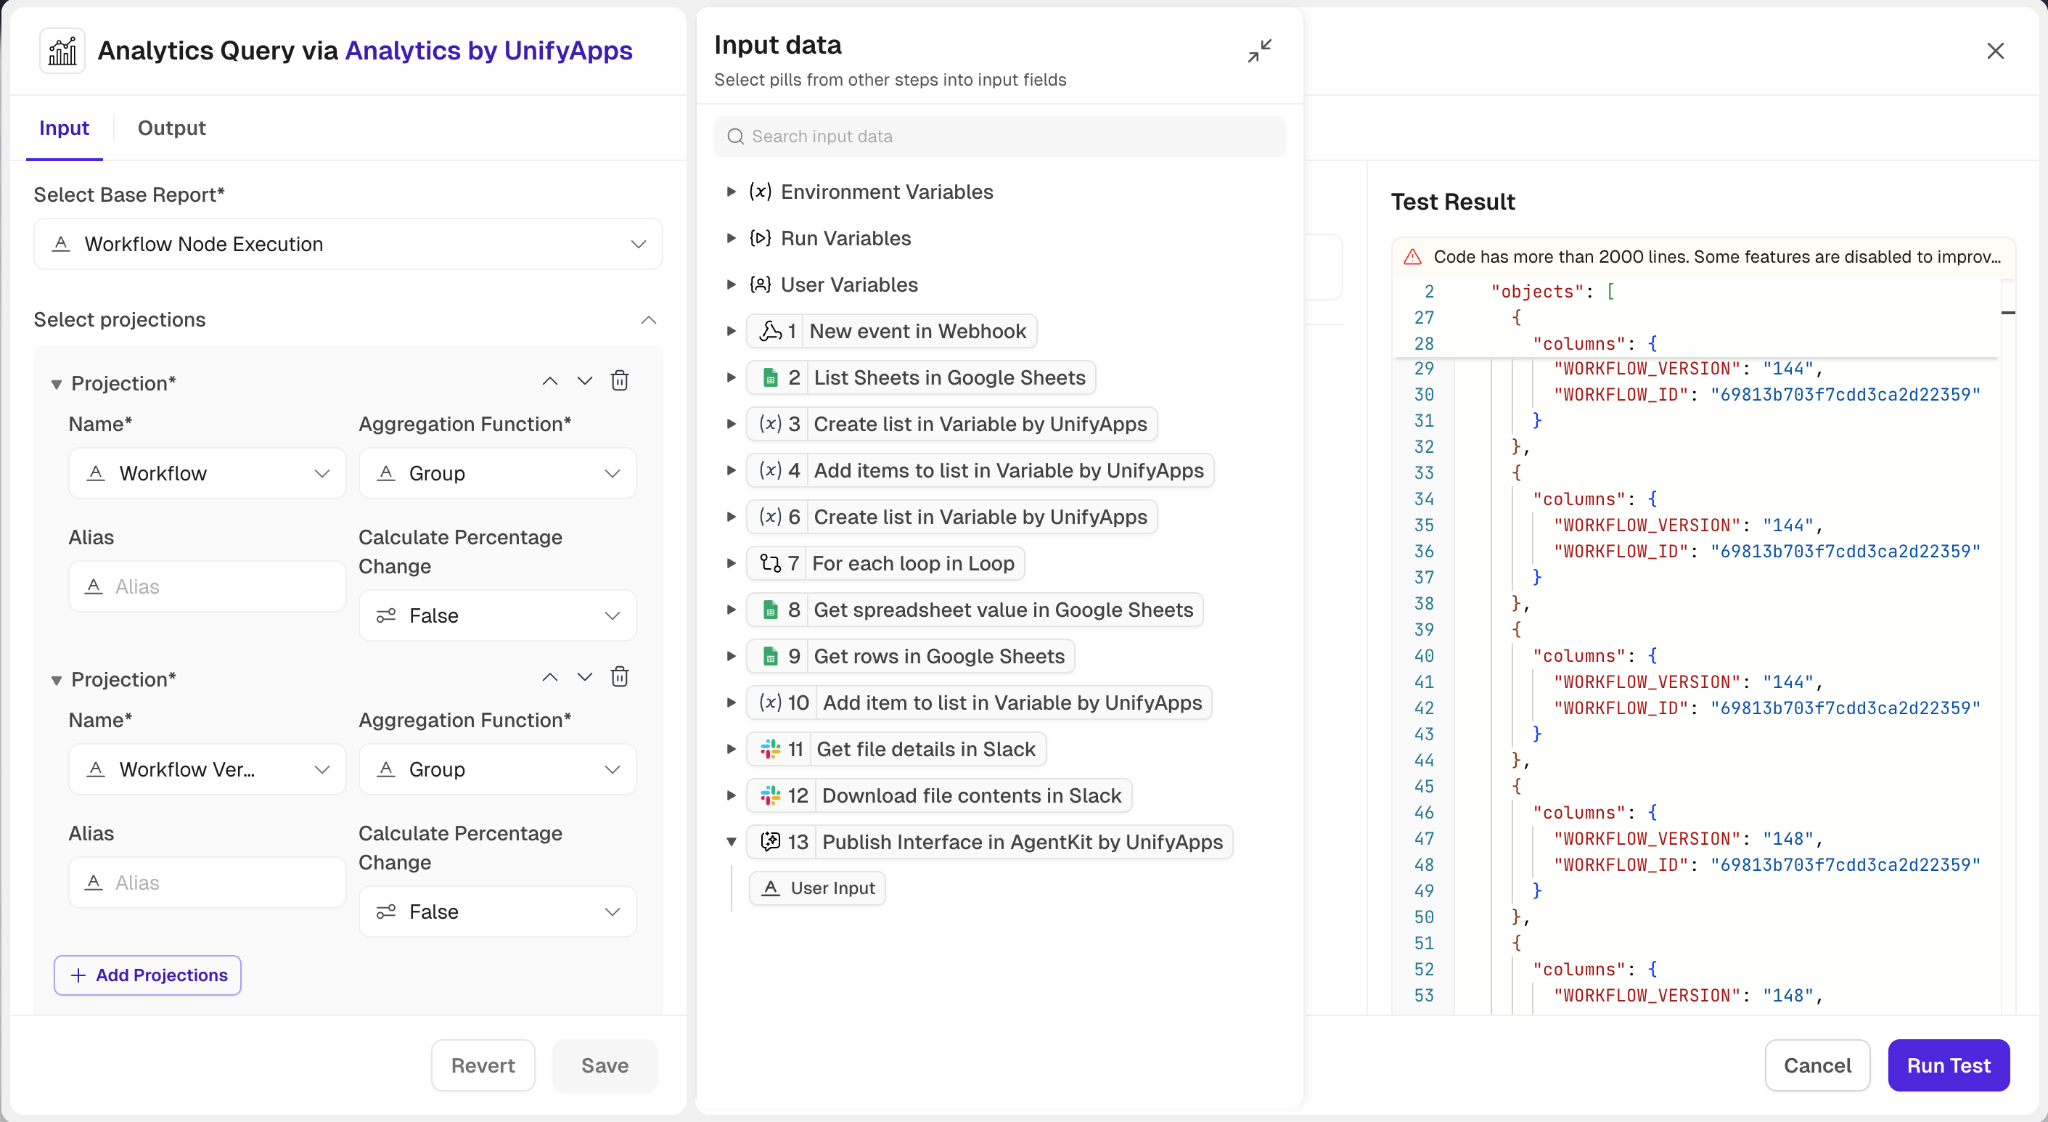
Select Additional Projections: Add supplementary projections with similar options for fields, aggregation, and percentage change inclusion.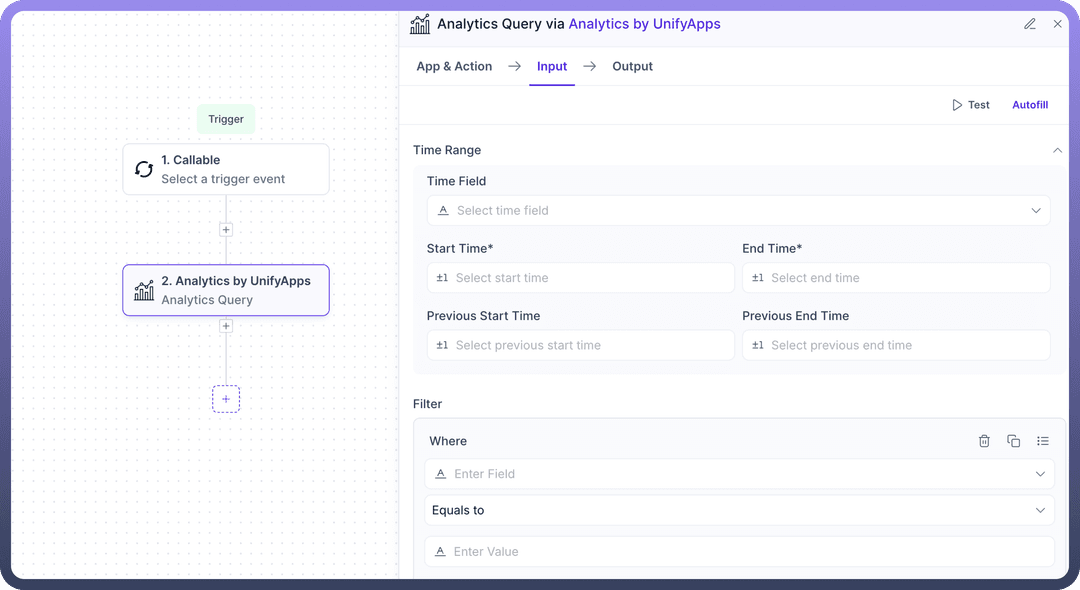
Time Range:Define a time field for the query.
Specify start and end times, including previous periods for comparison.
.png&w=1080&q=75)
.png)
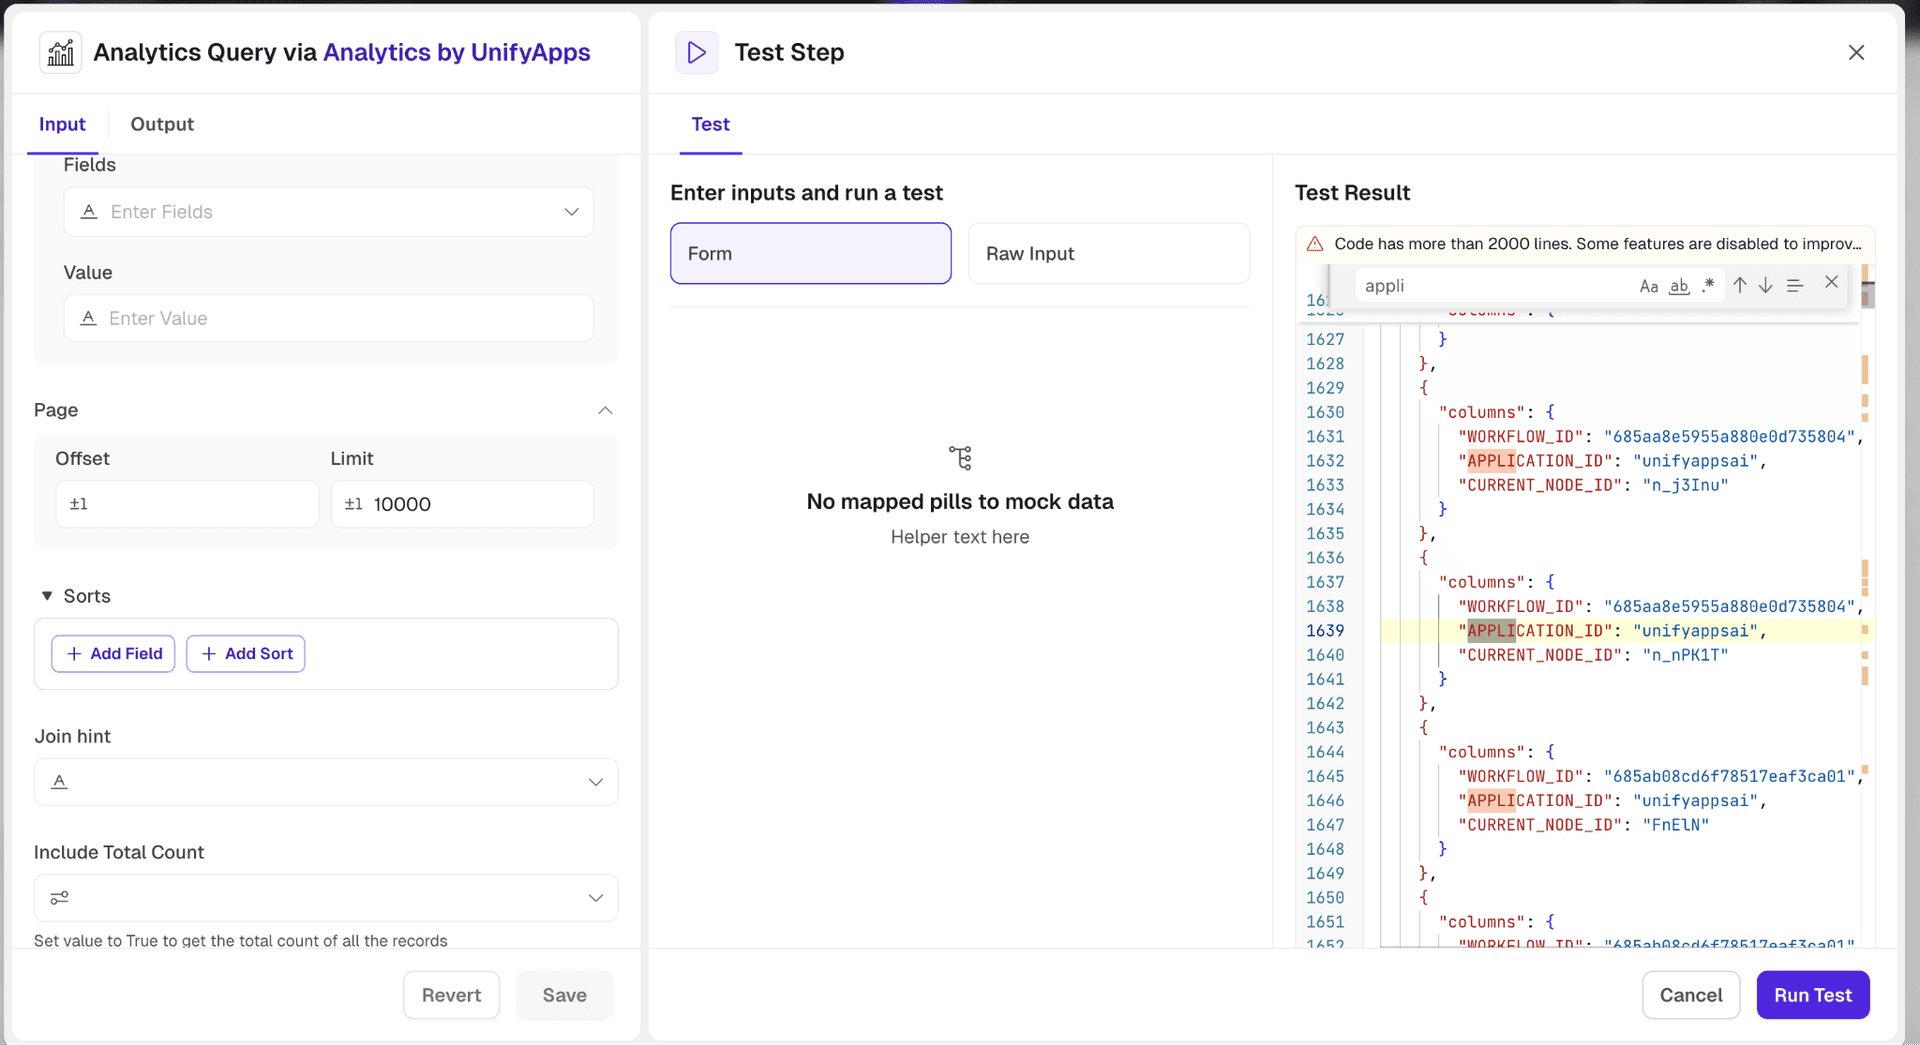
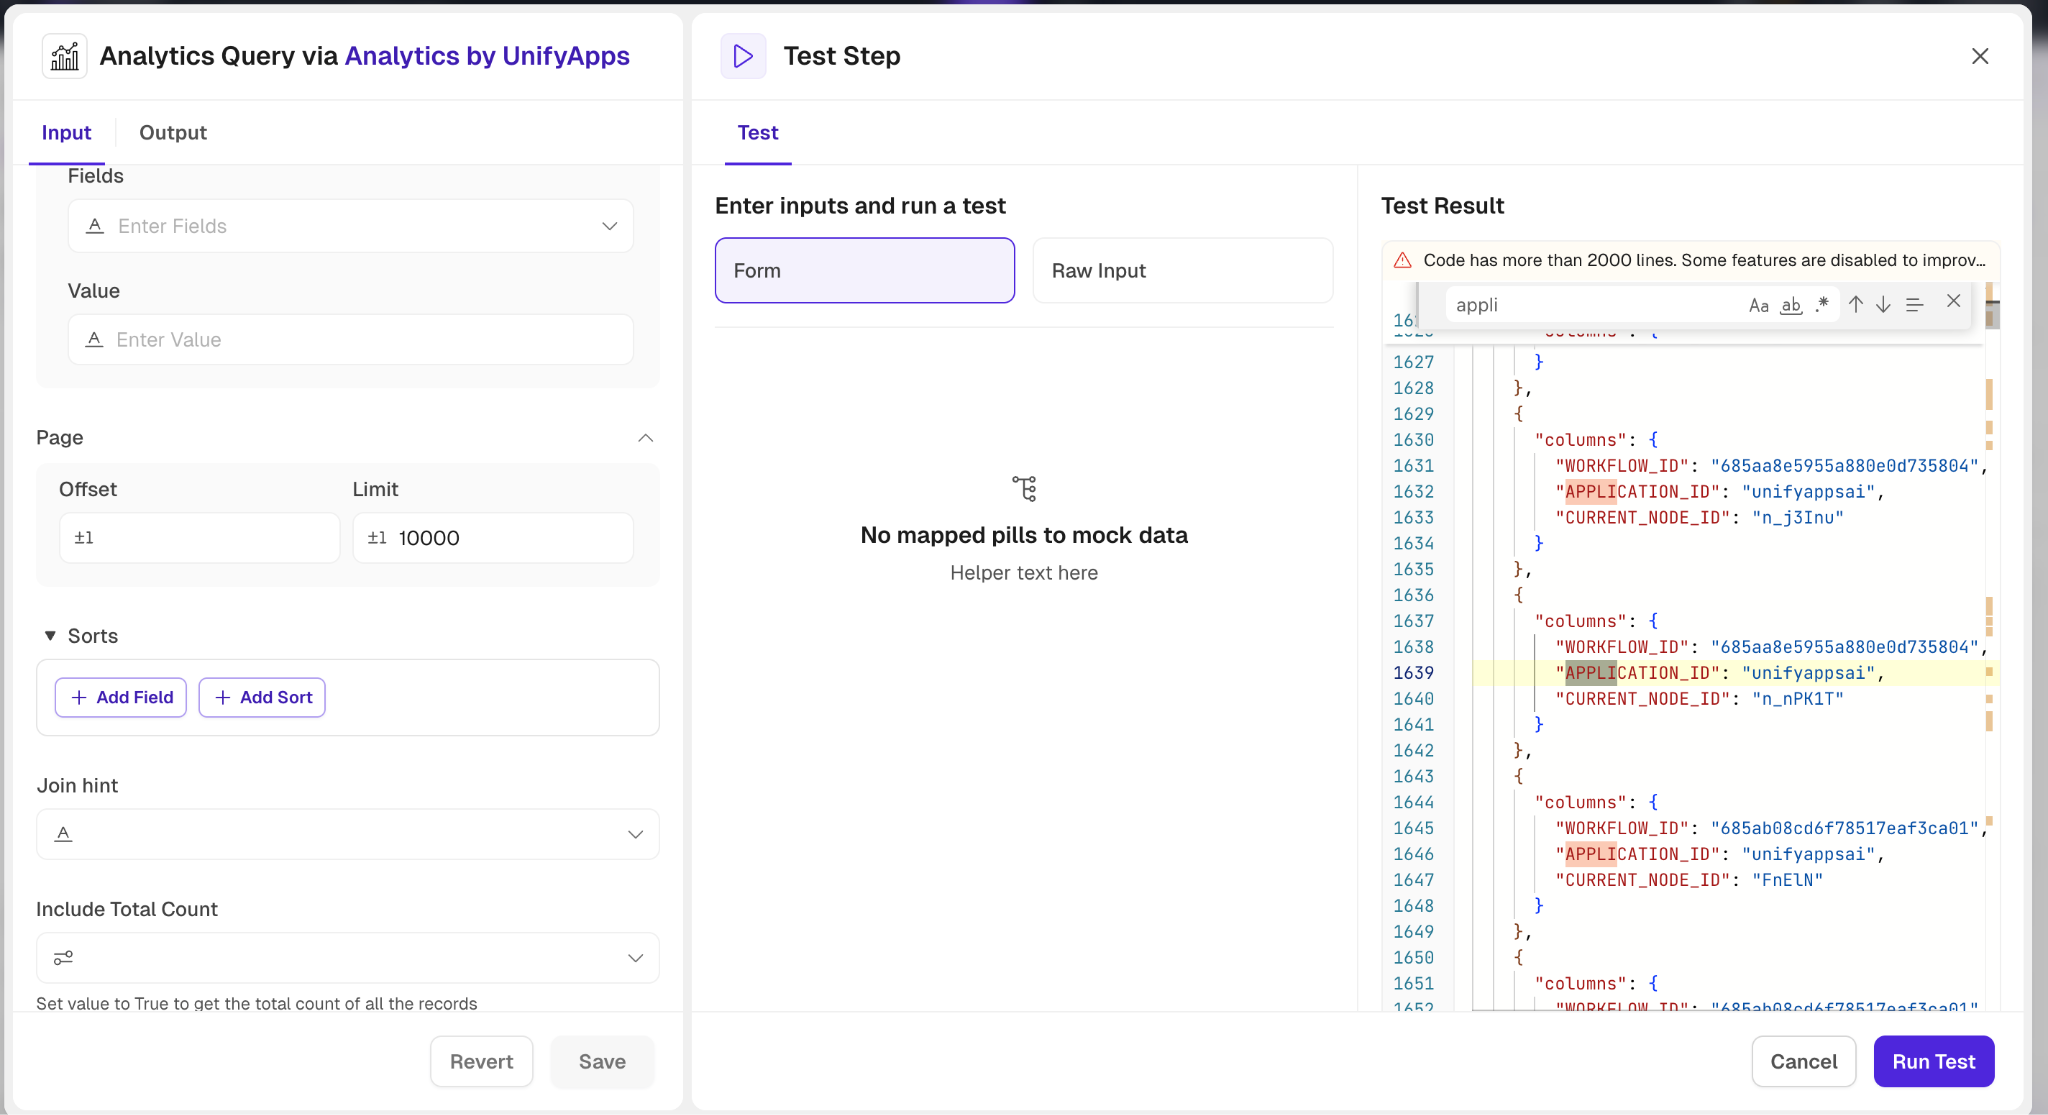
Filter:Create conditions using fields and values to filter data efficiently.
Add multiple conditions or condition groups for complex queries.
Search Object:Specify fields and their values to narrow down search results further.
Pagination:Use Offset and Limit to manage the number of records retrieved.
Sorting:Add fields to sort the results by specific attributes.
Include Total Count:Set this option to true for retrieving the total count of records matching the query.
This action allows robust customization to extract insights effectively from large datasets while offering precision in data manipulation.
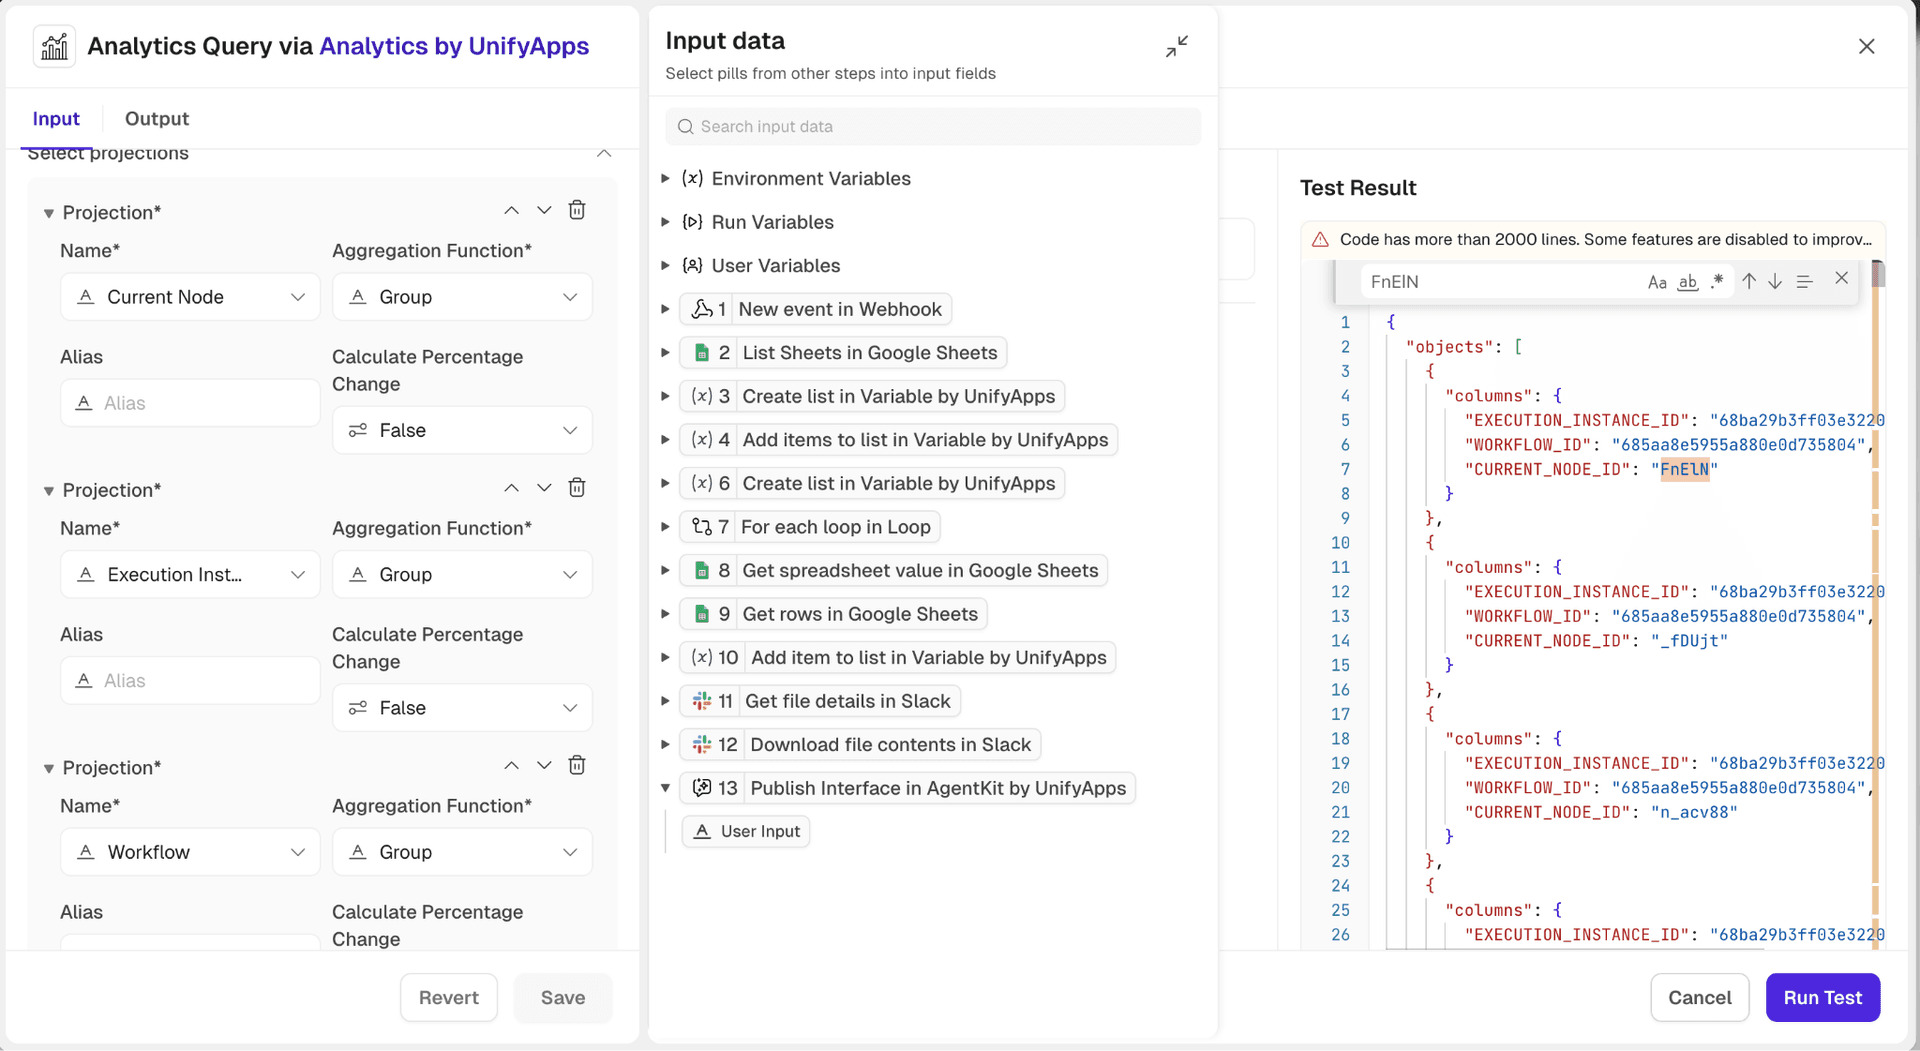
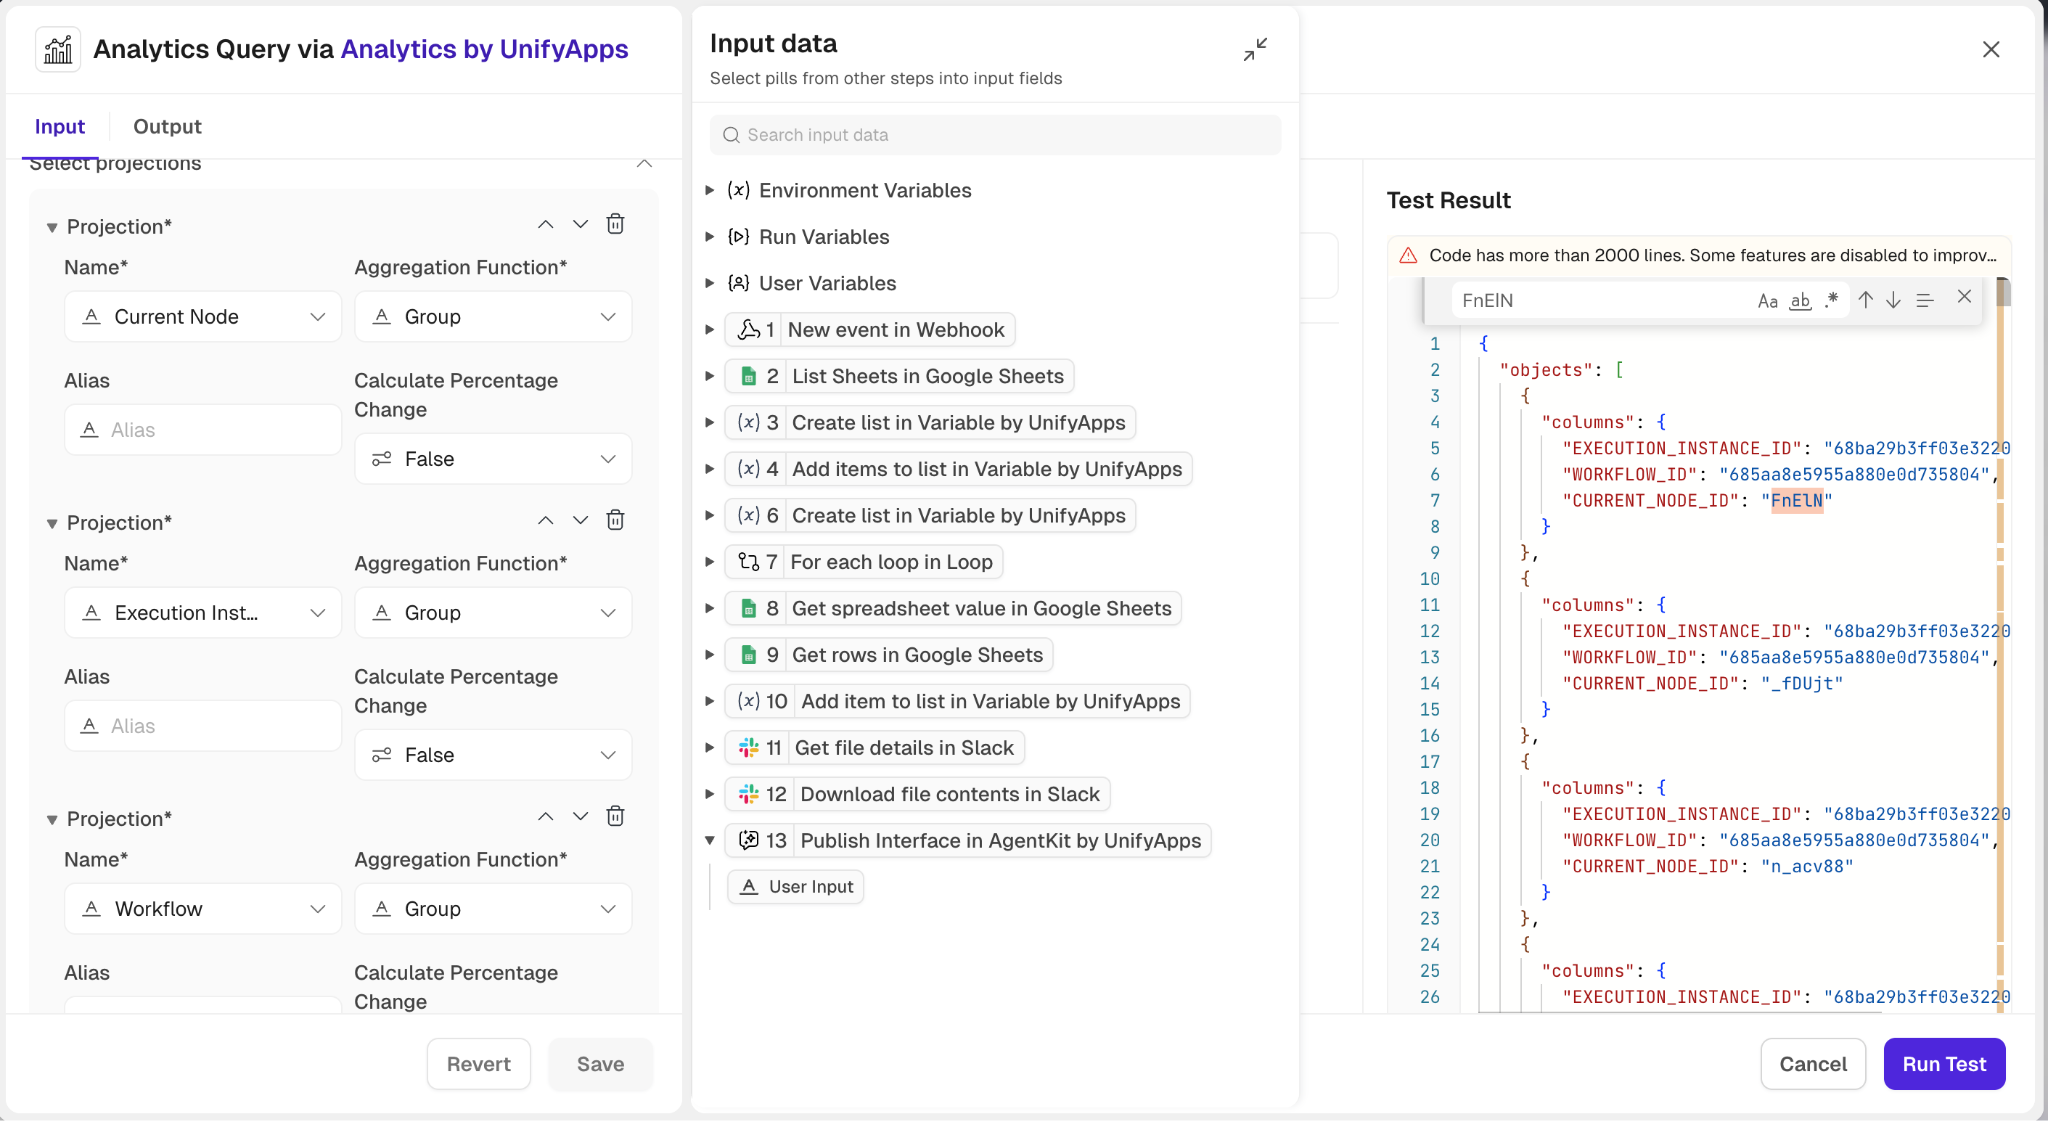
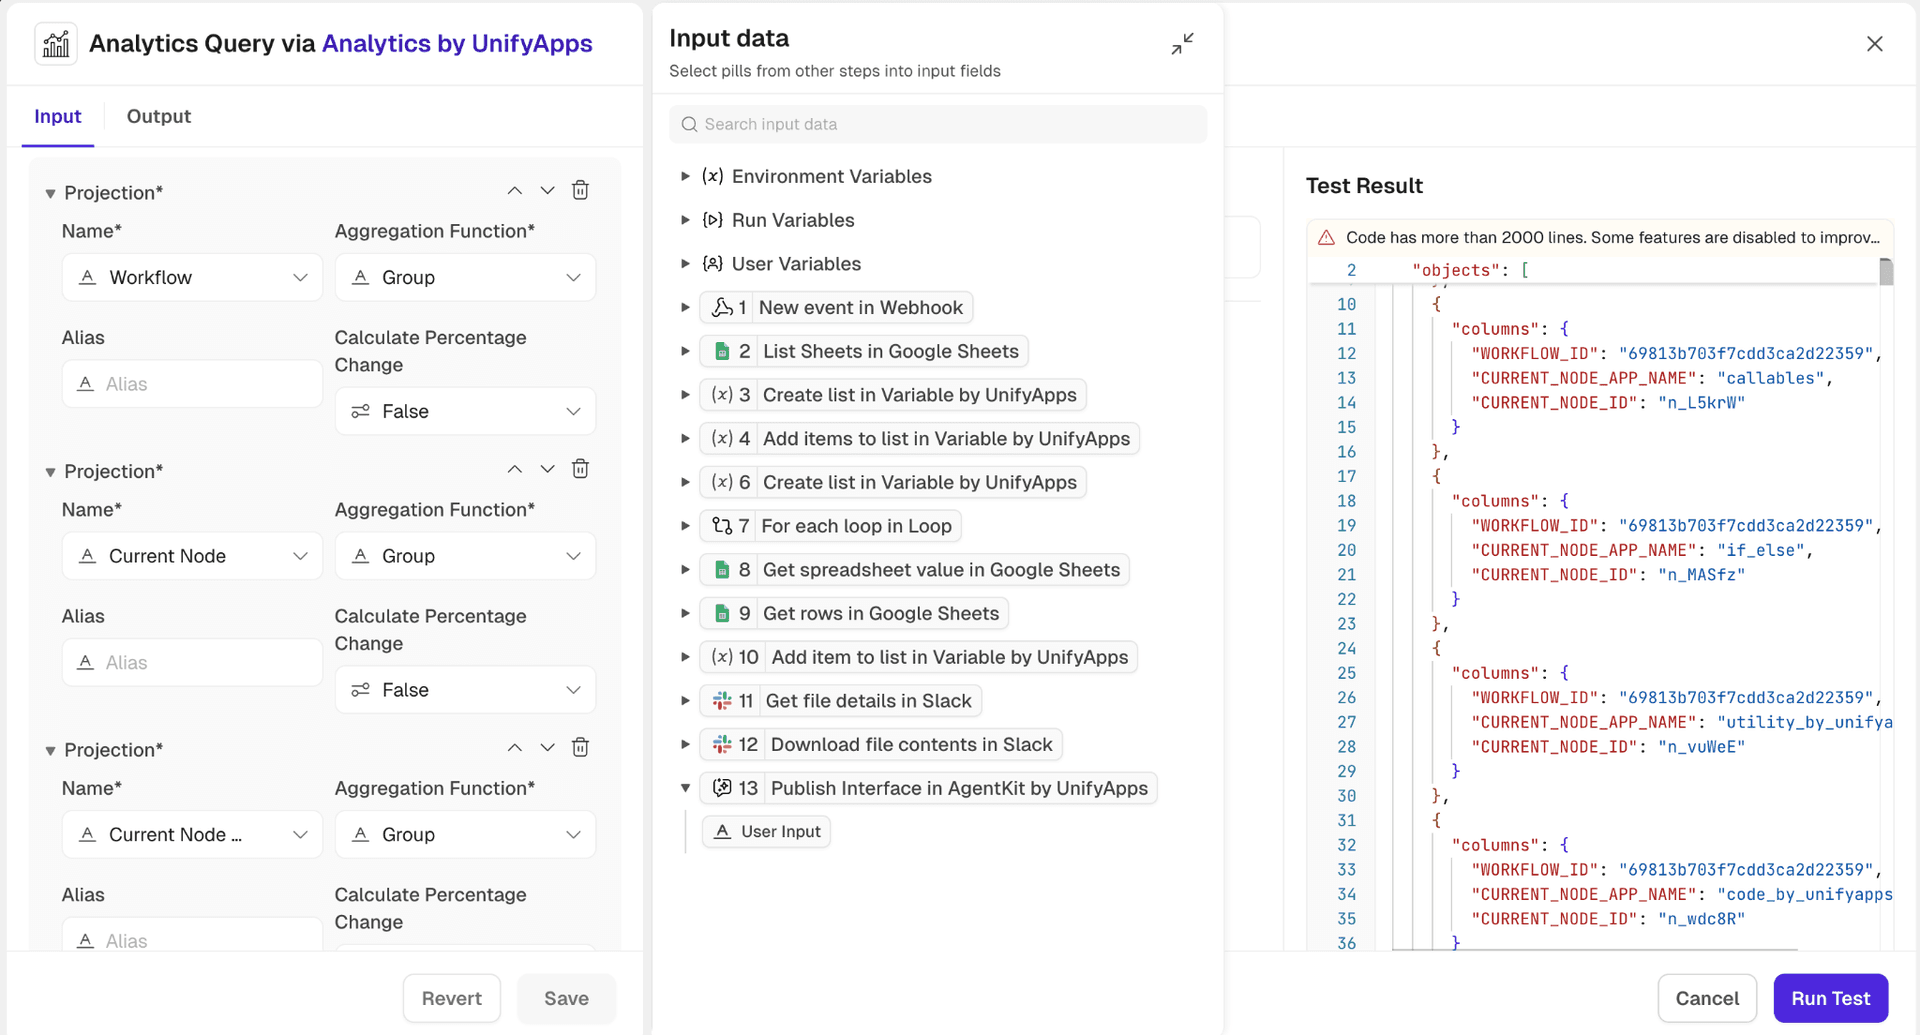
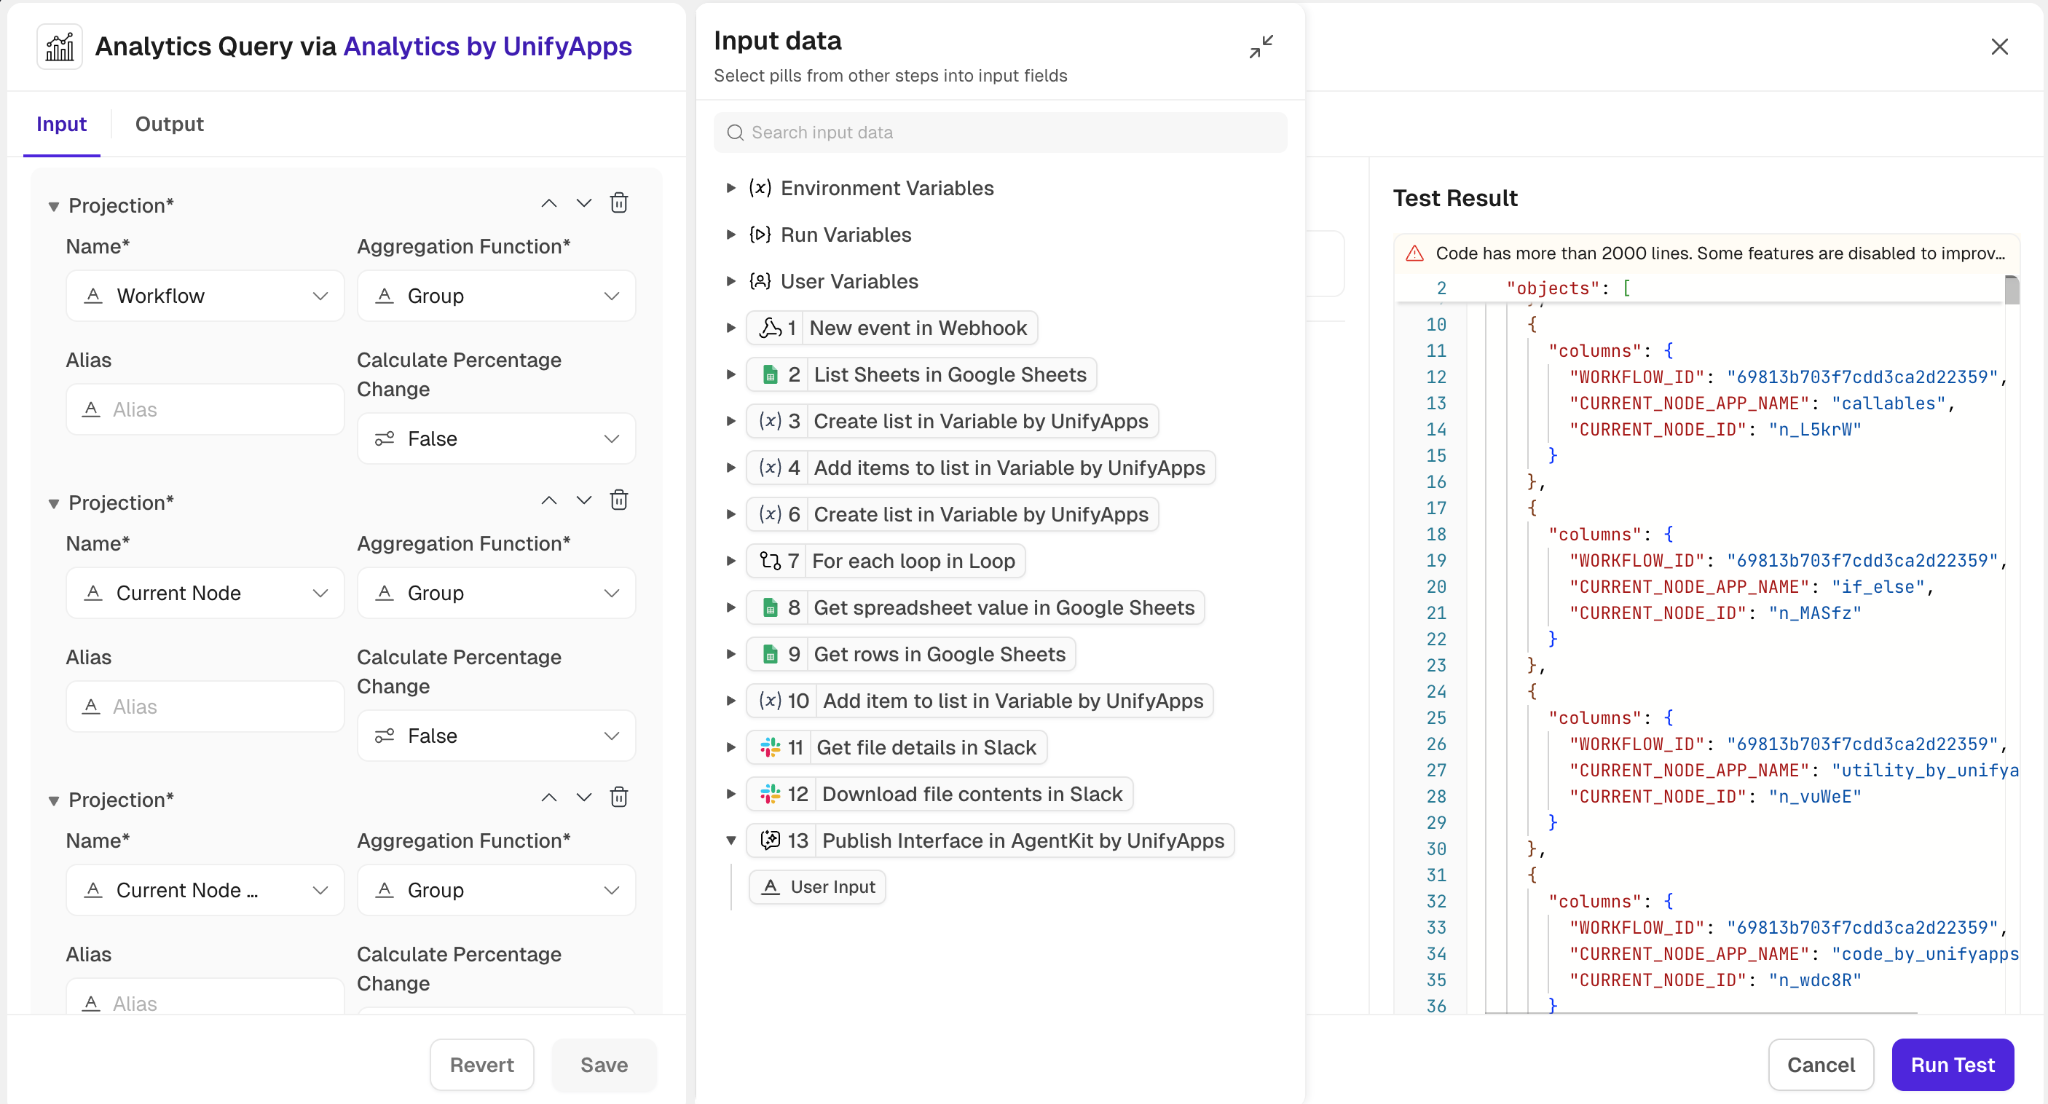
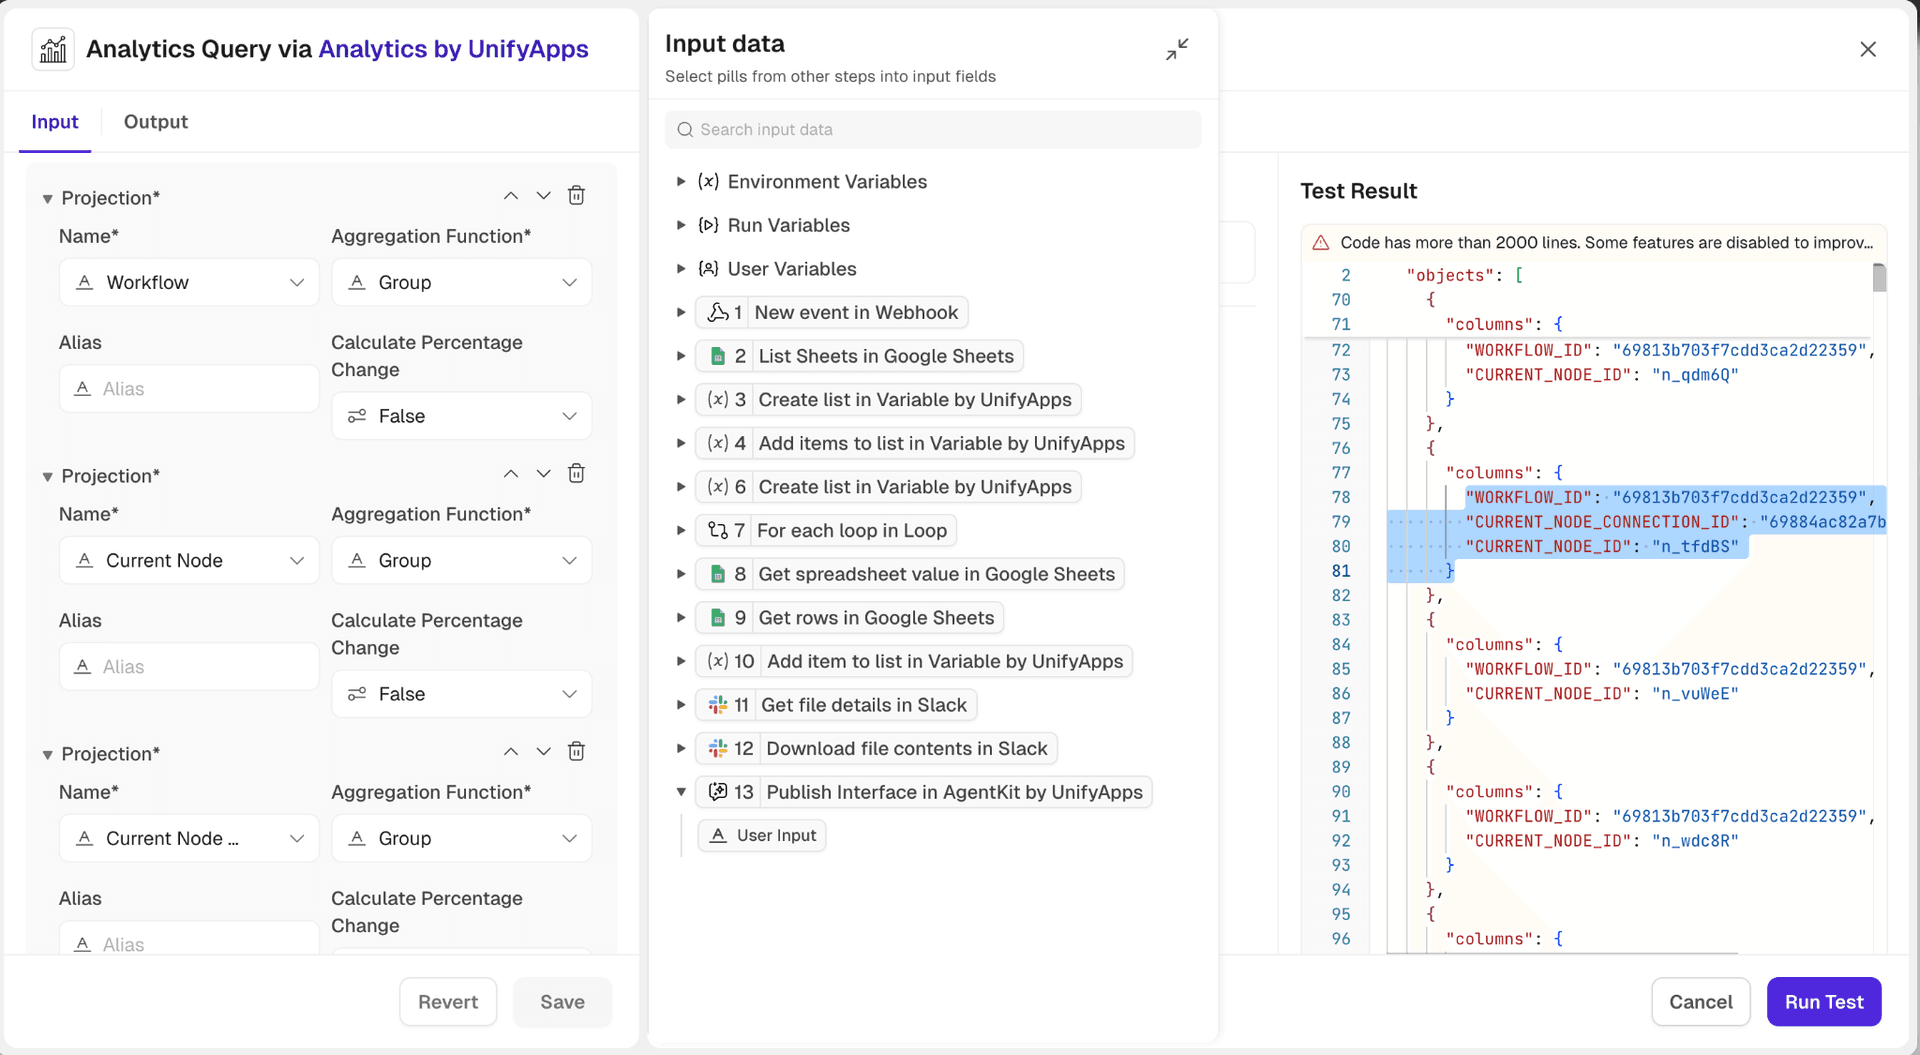
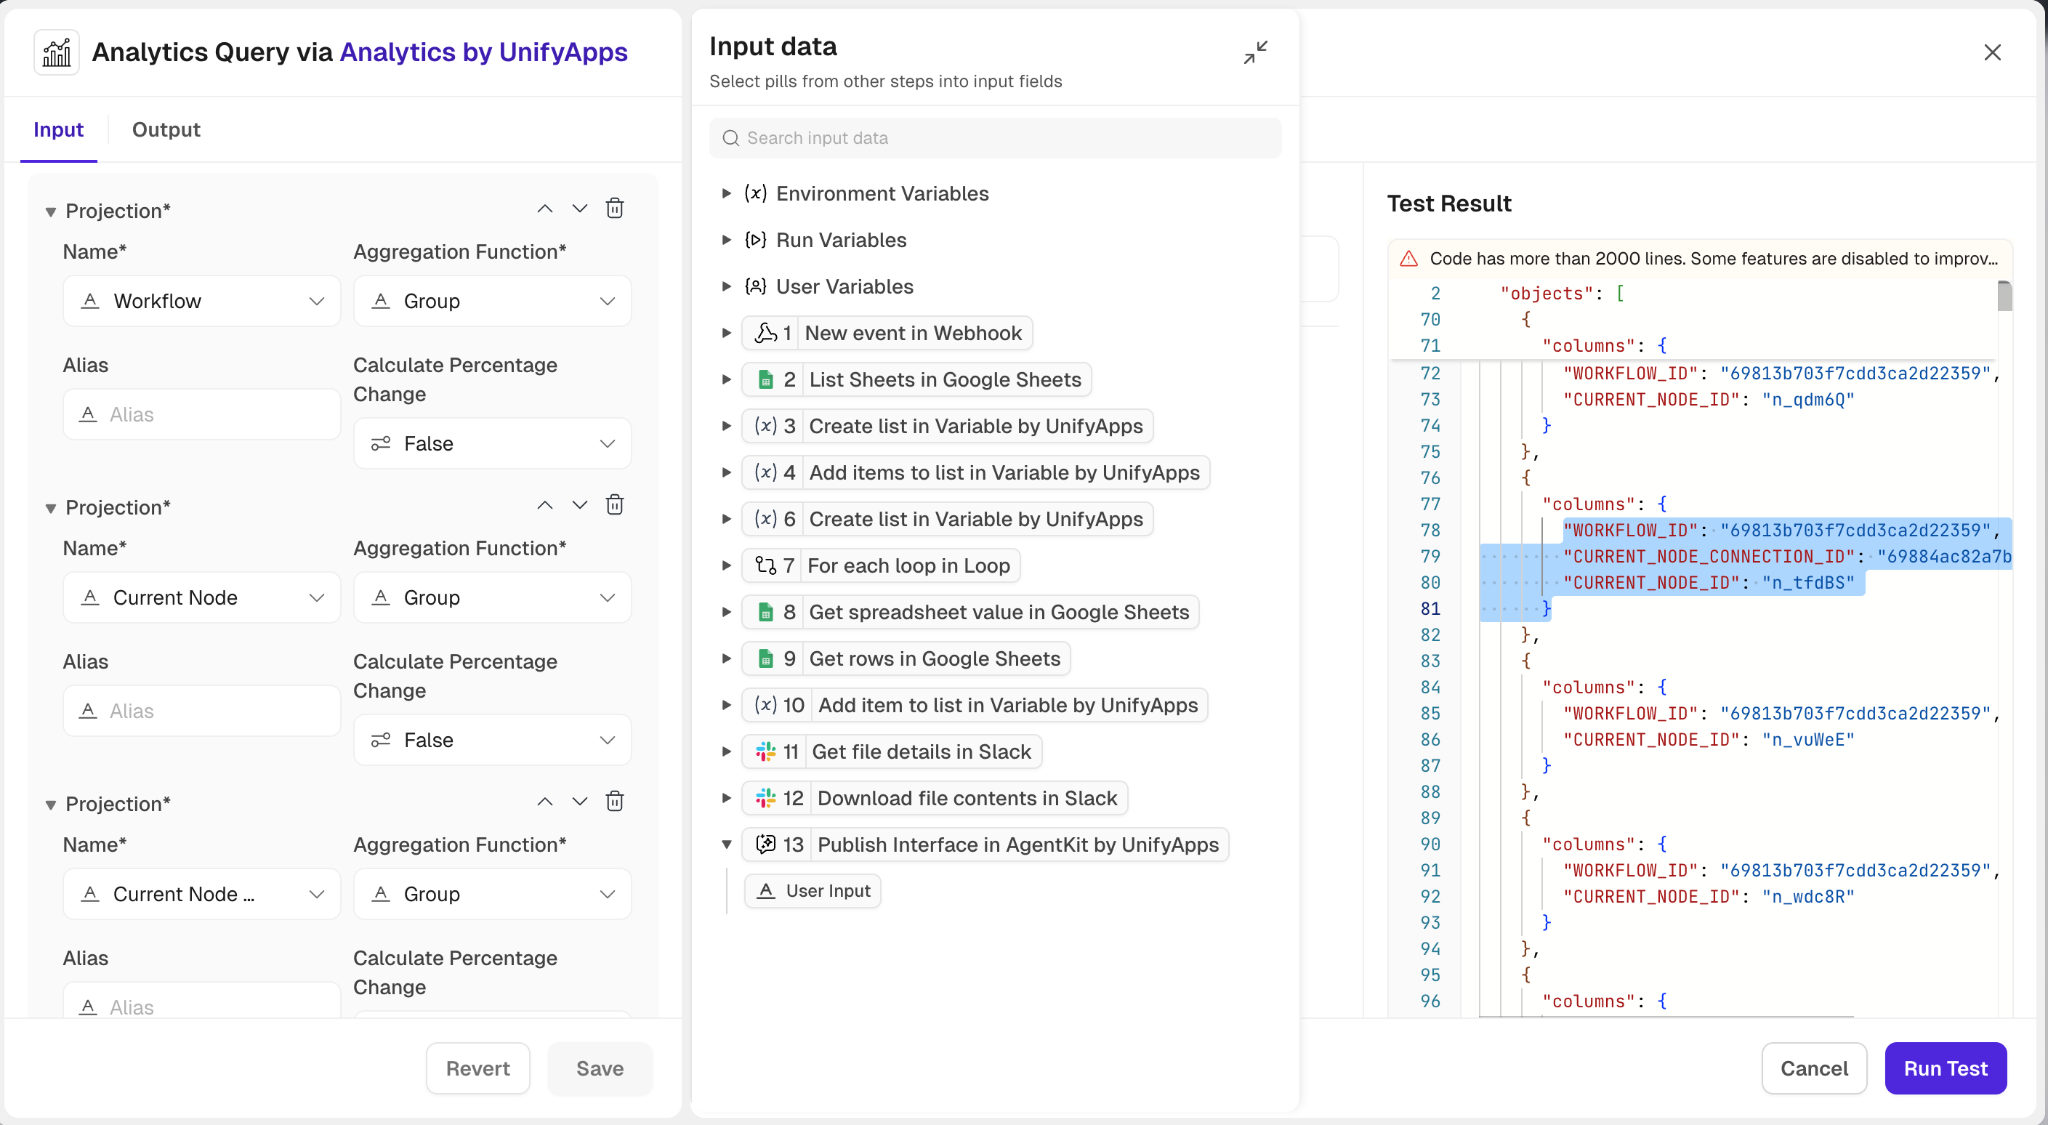
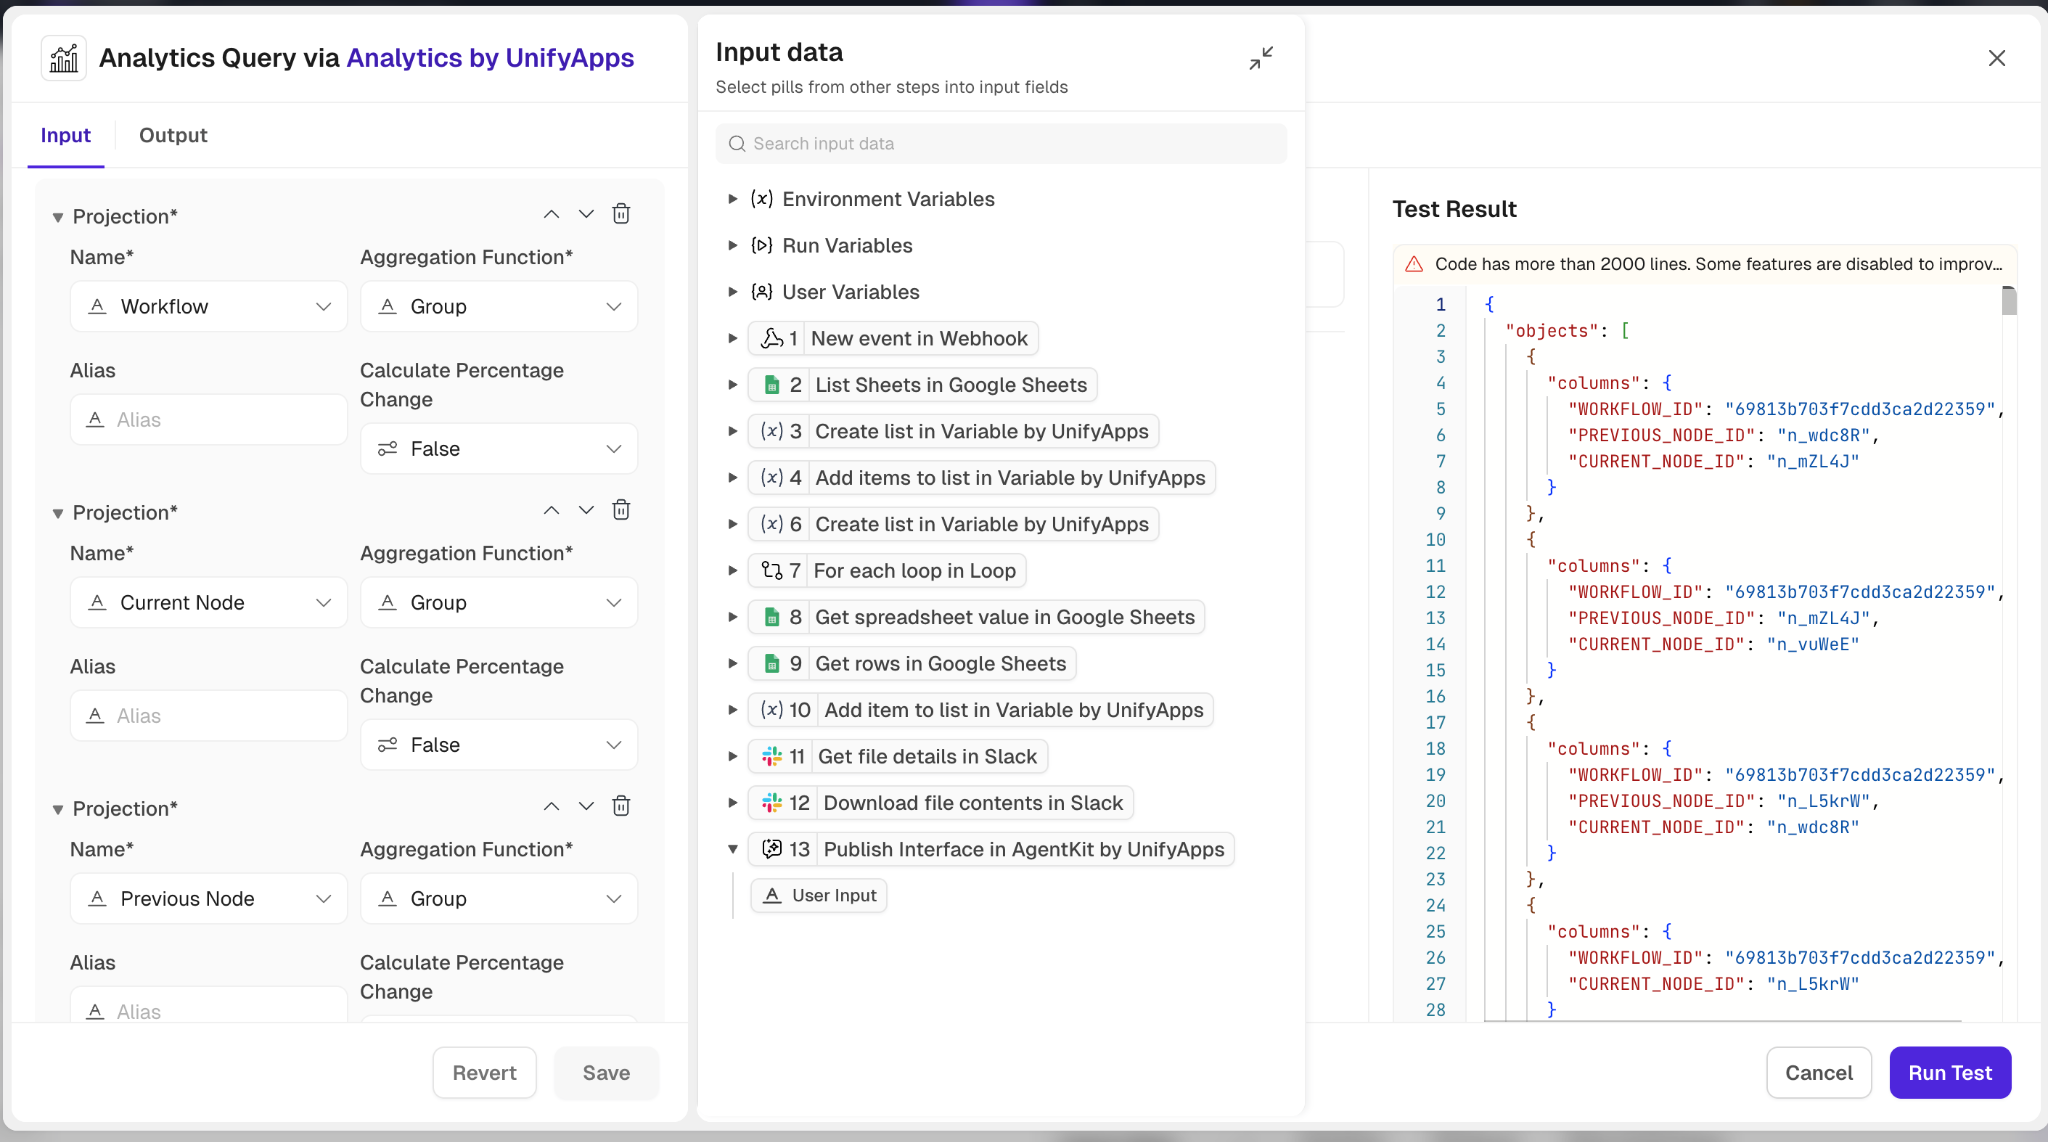
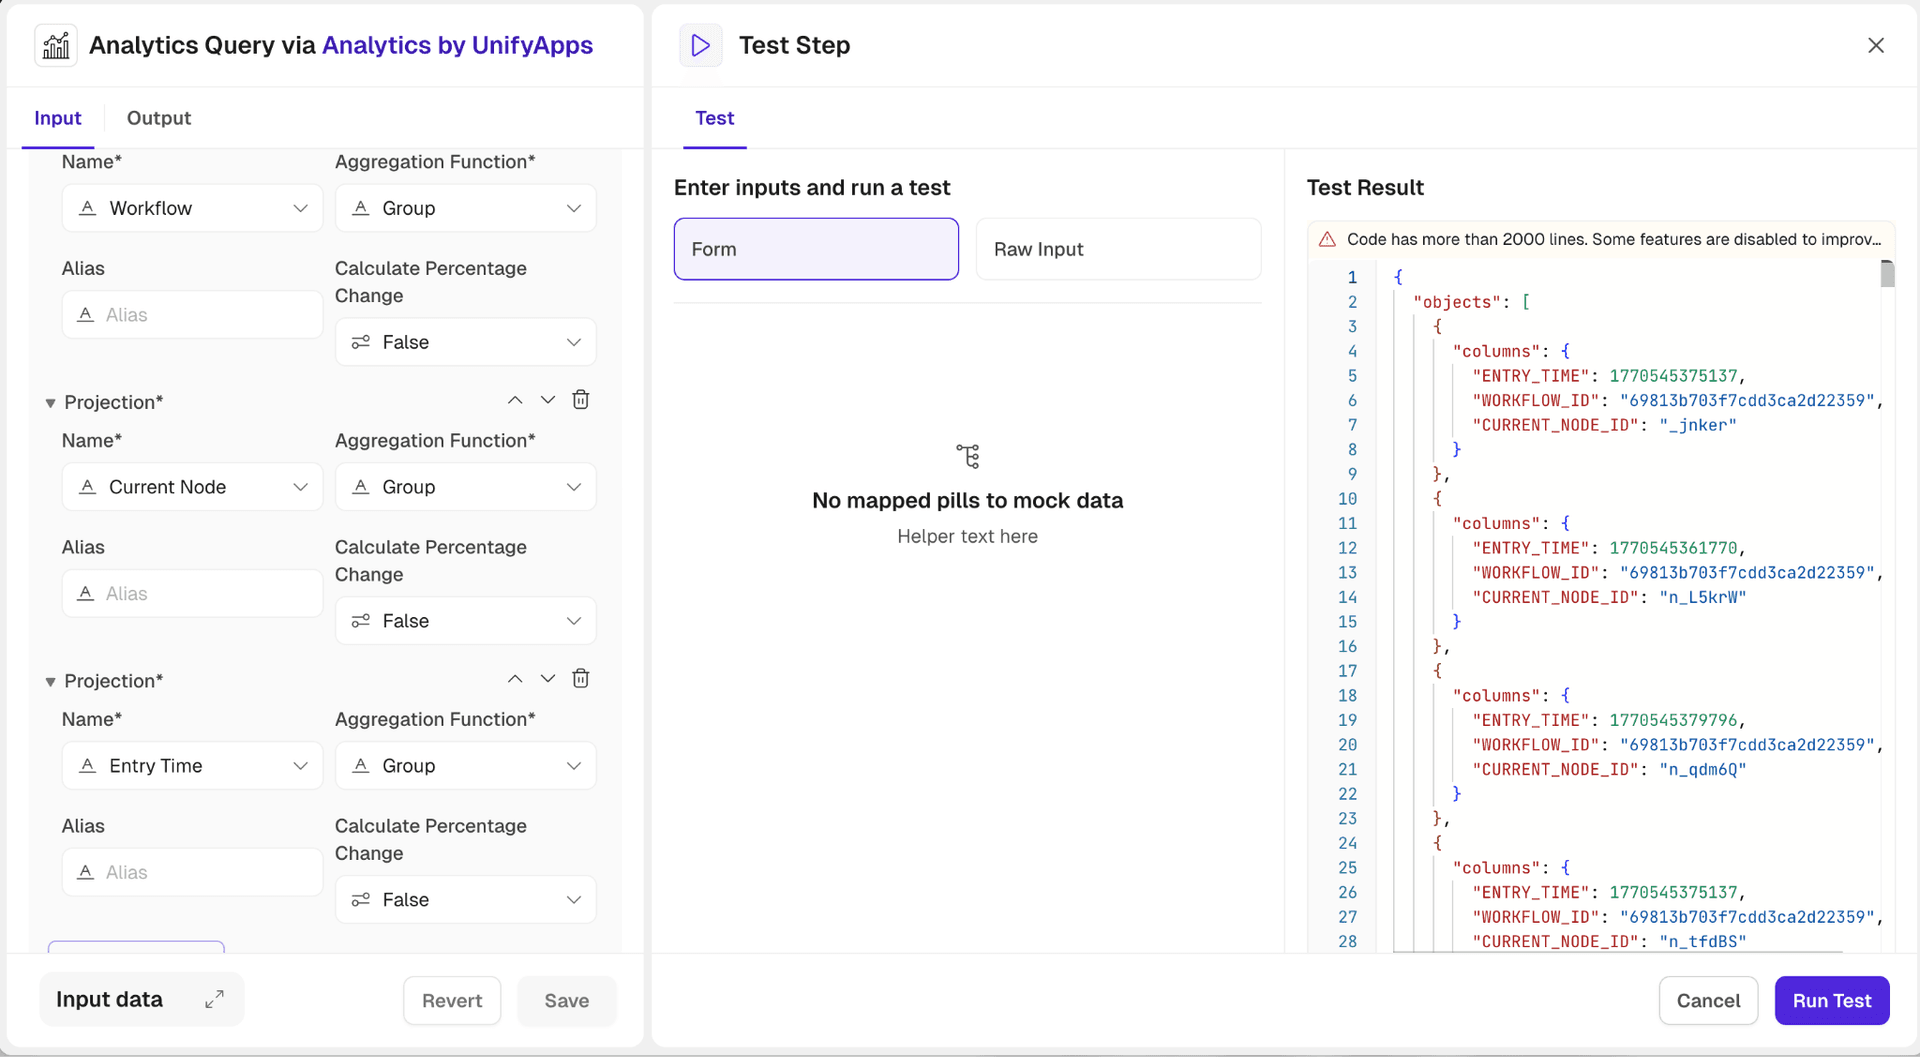
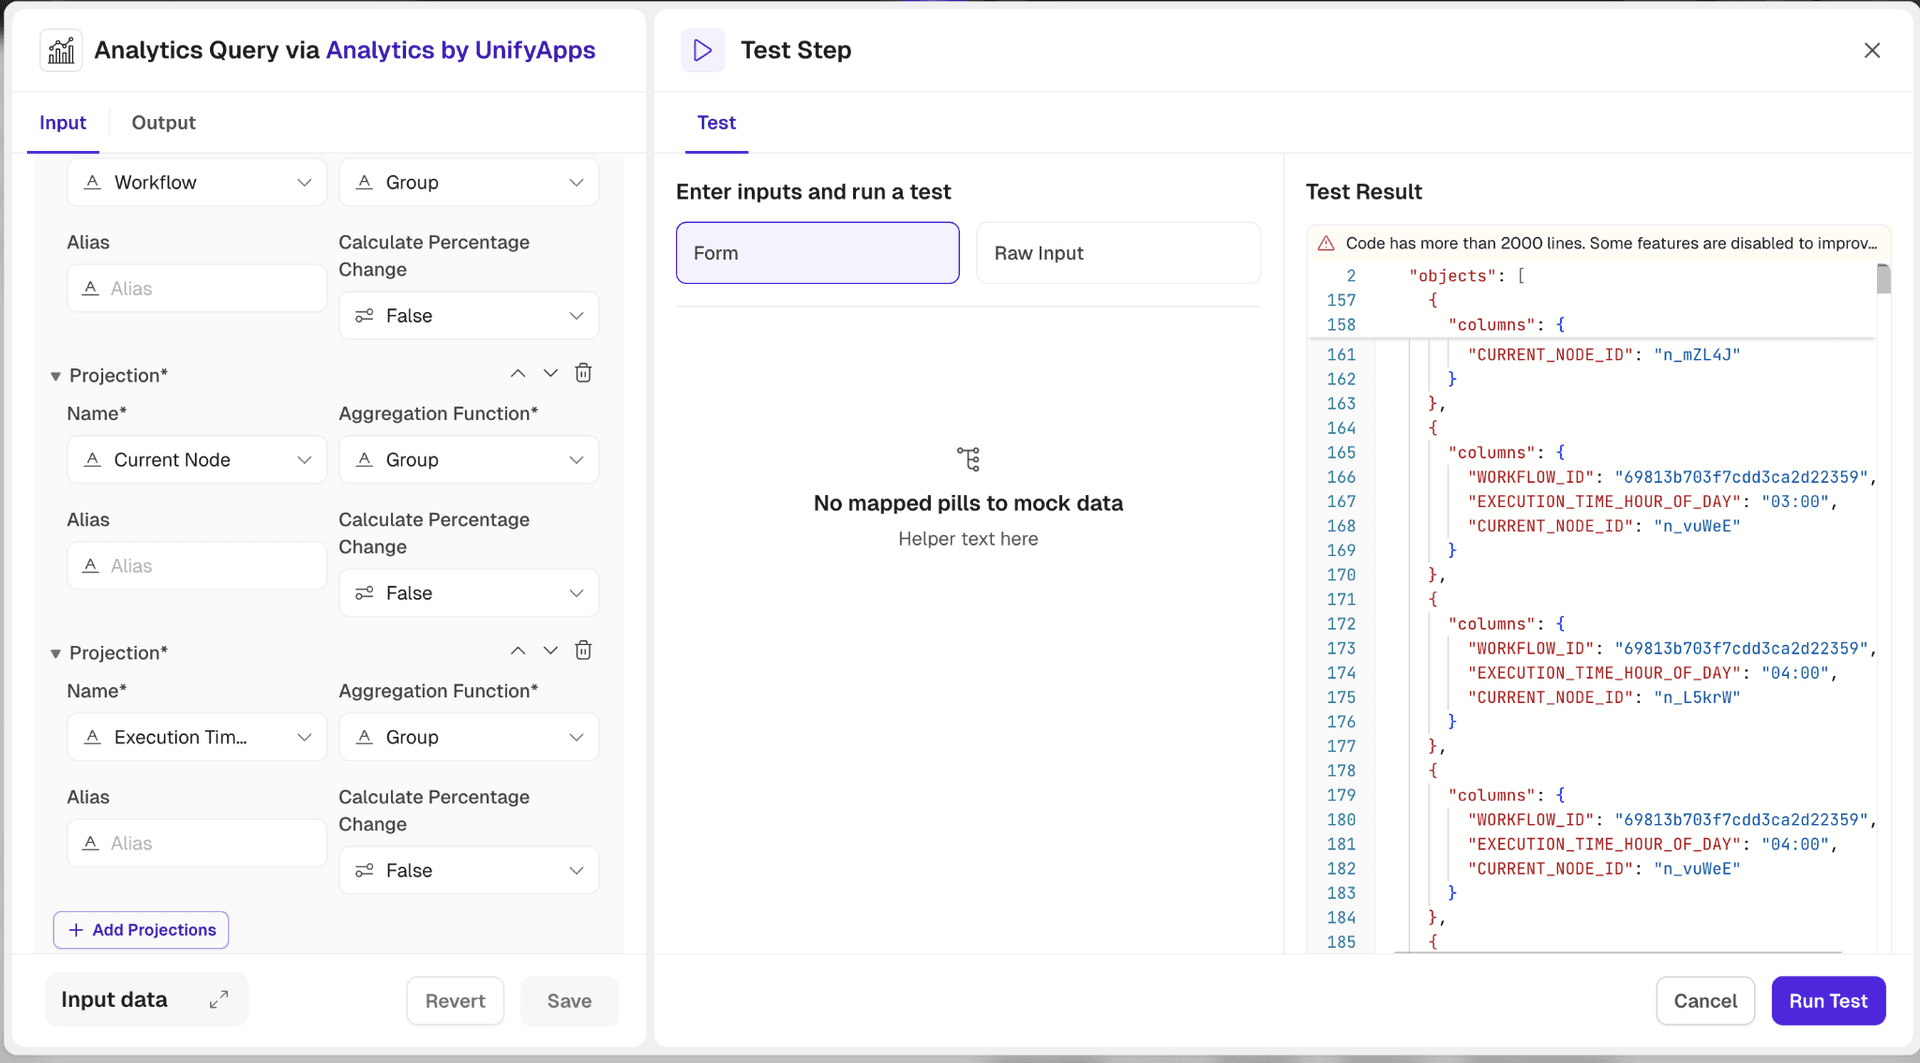
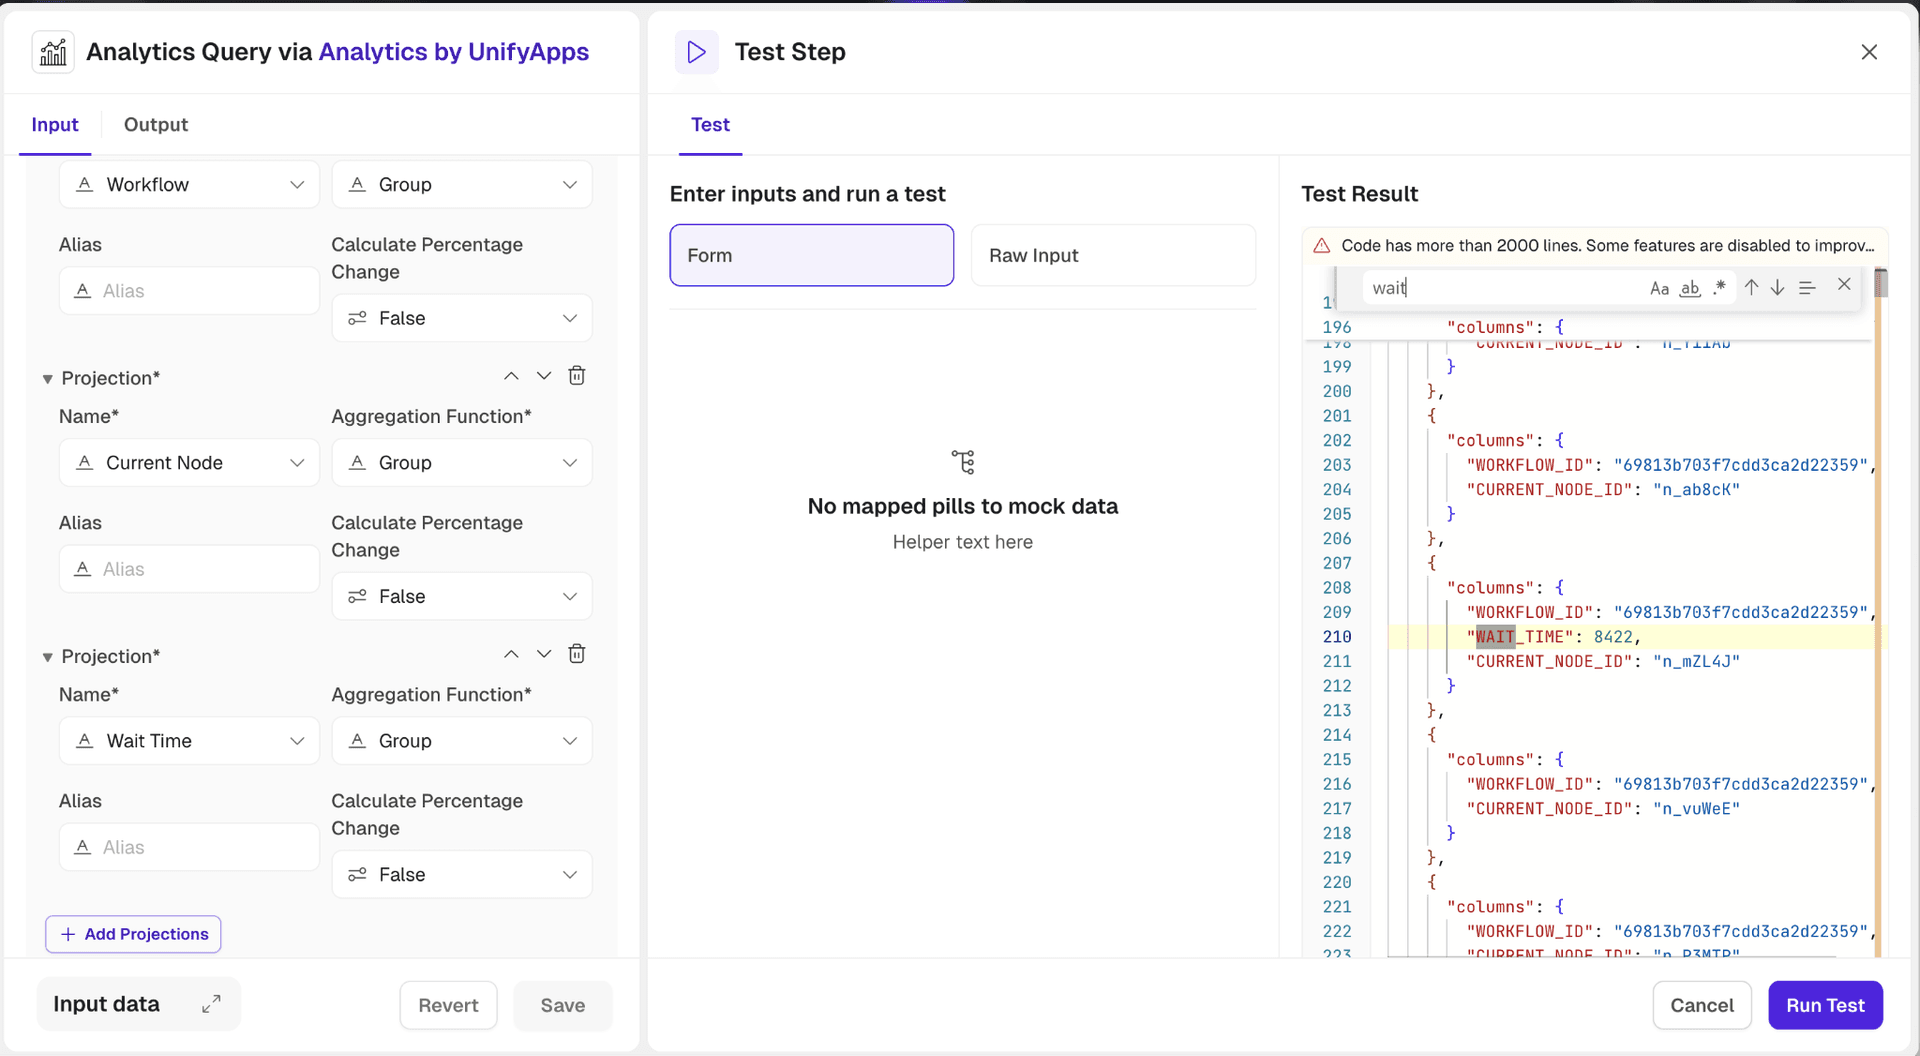
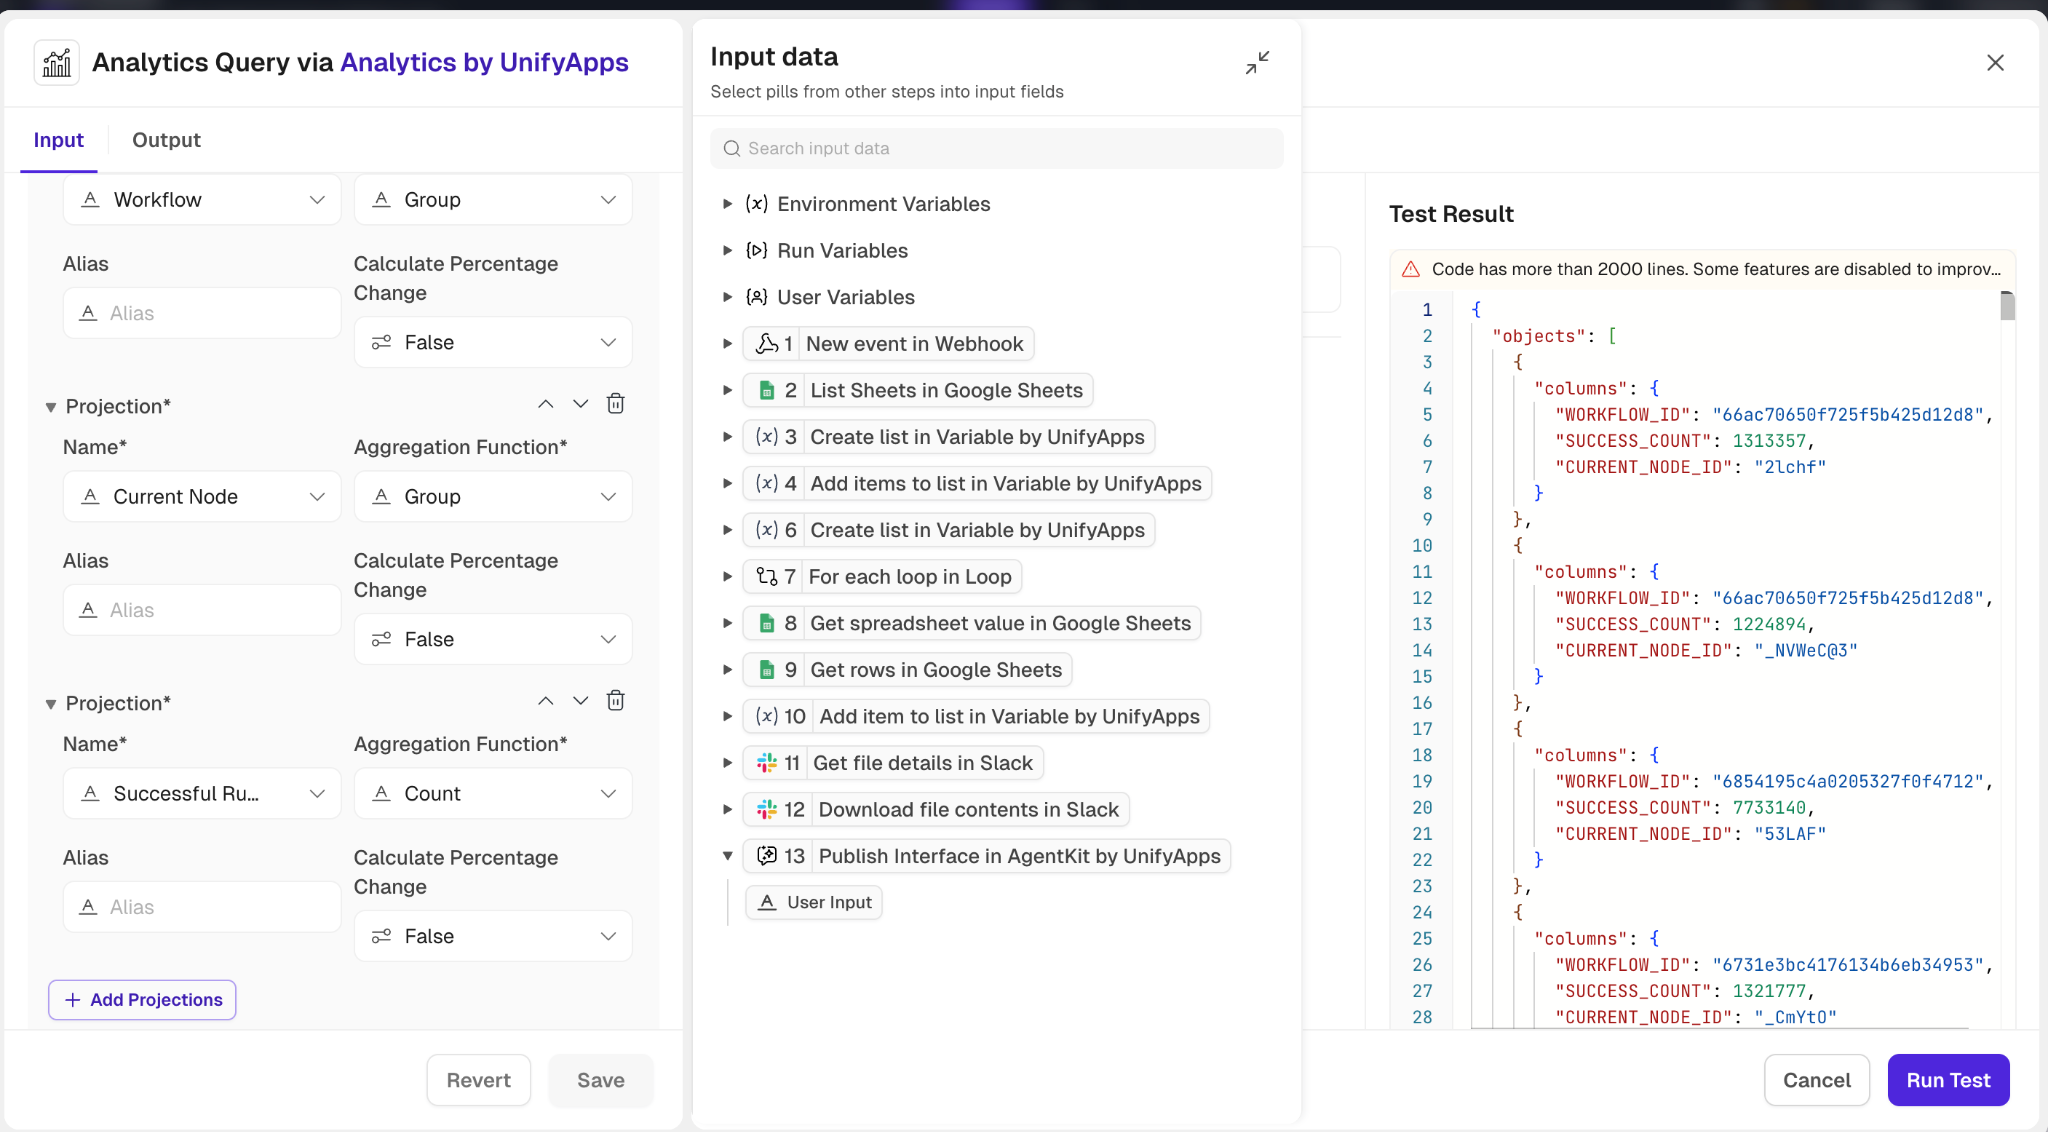
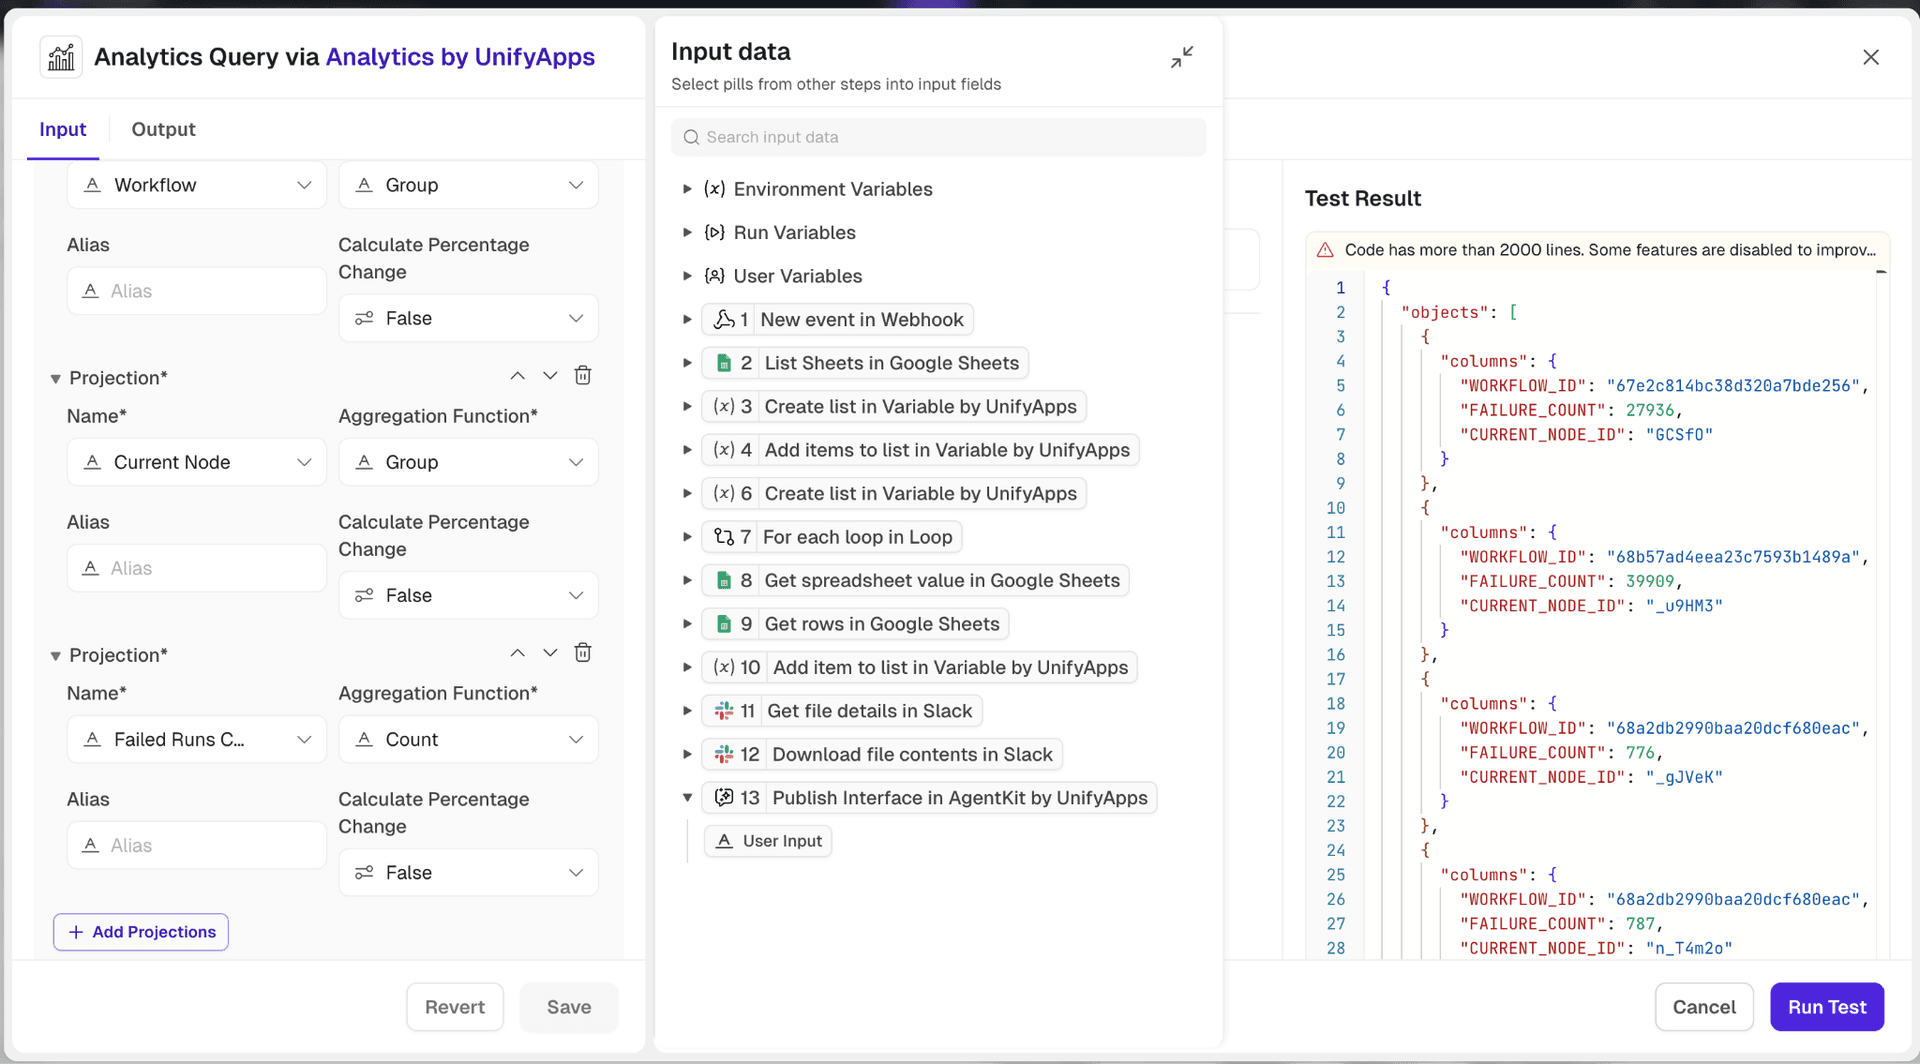
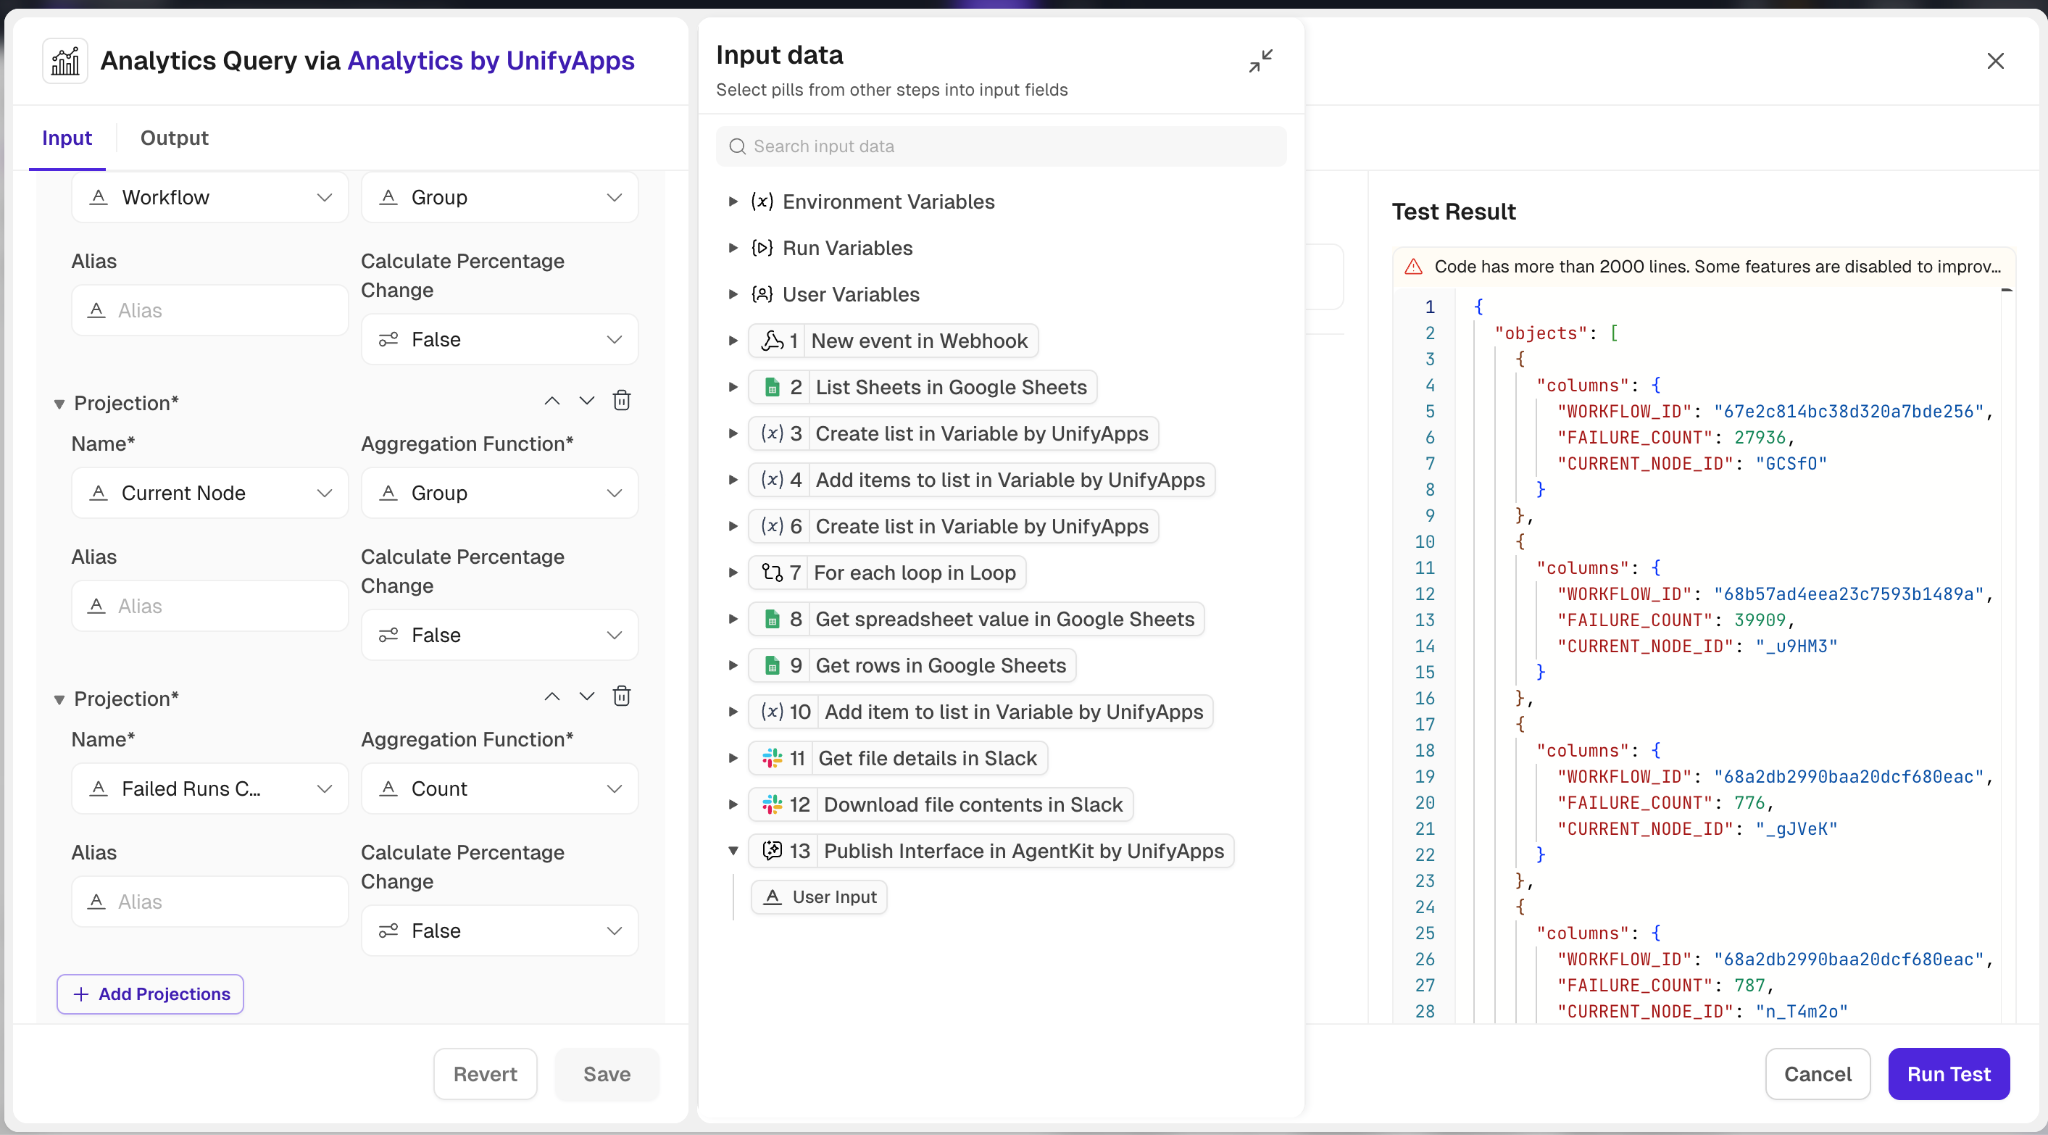
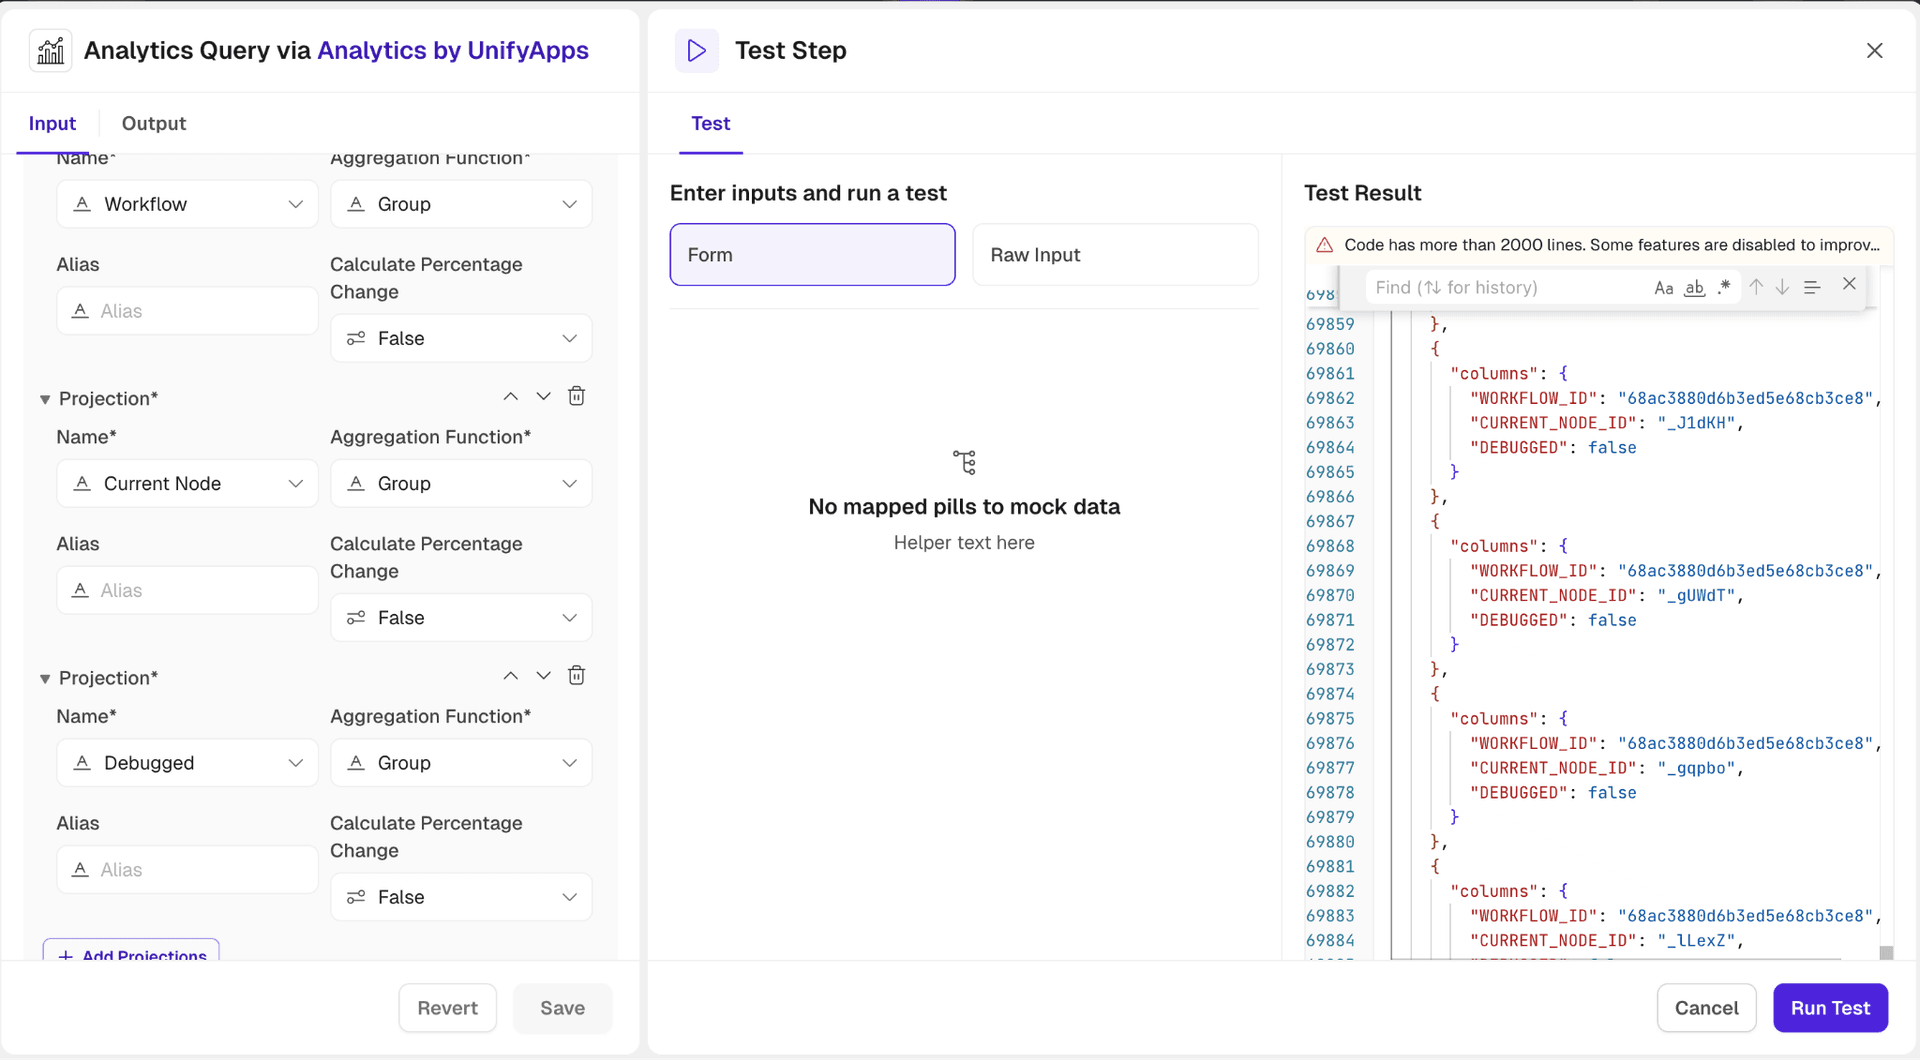
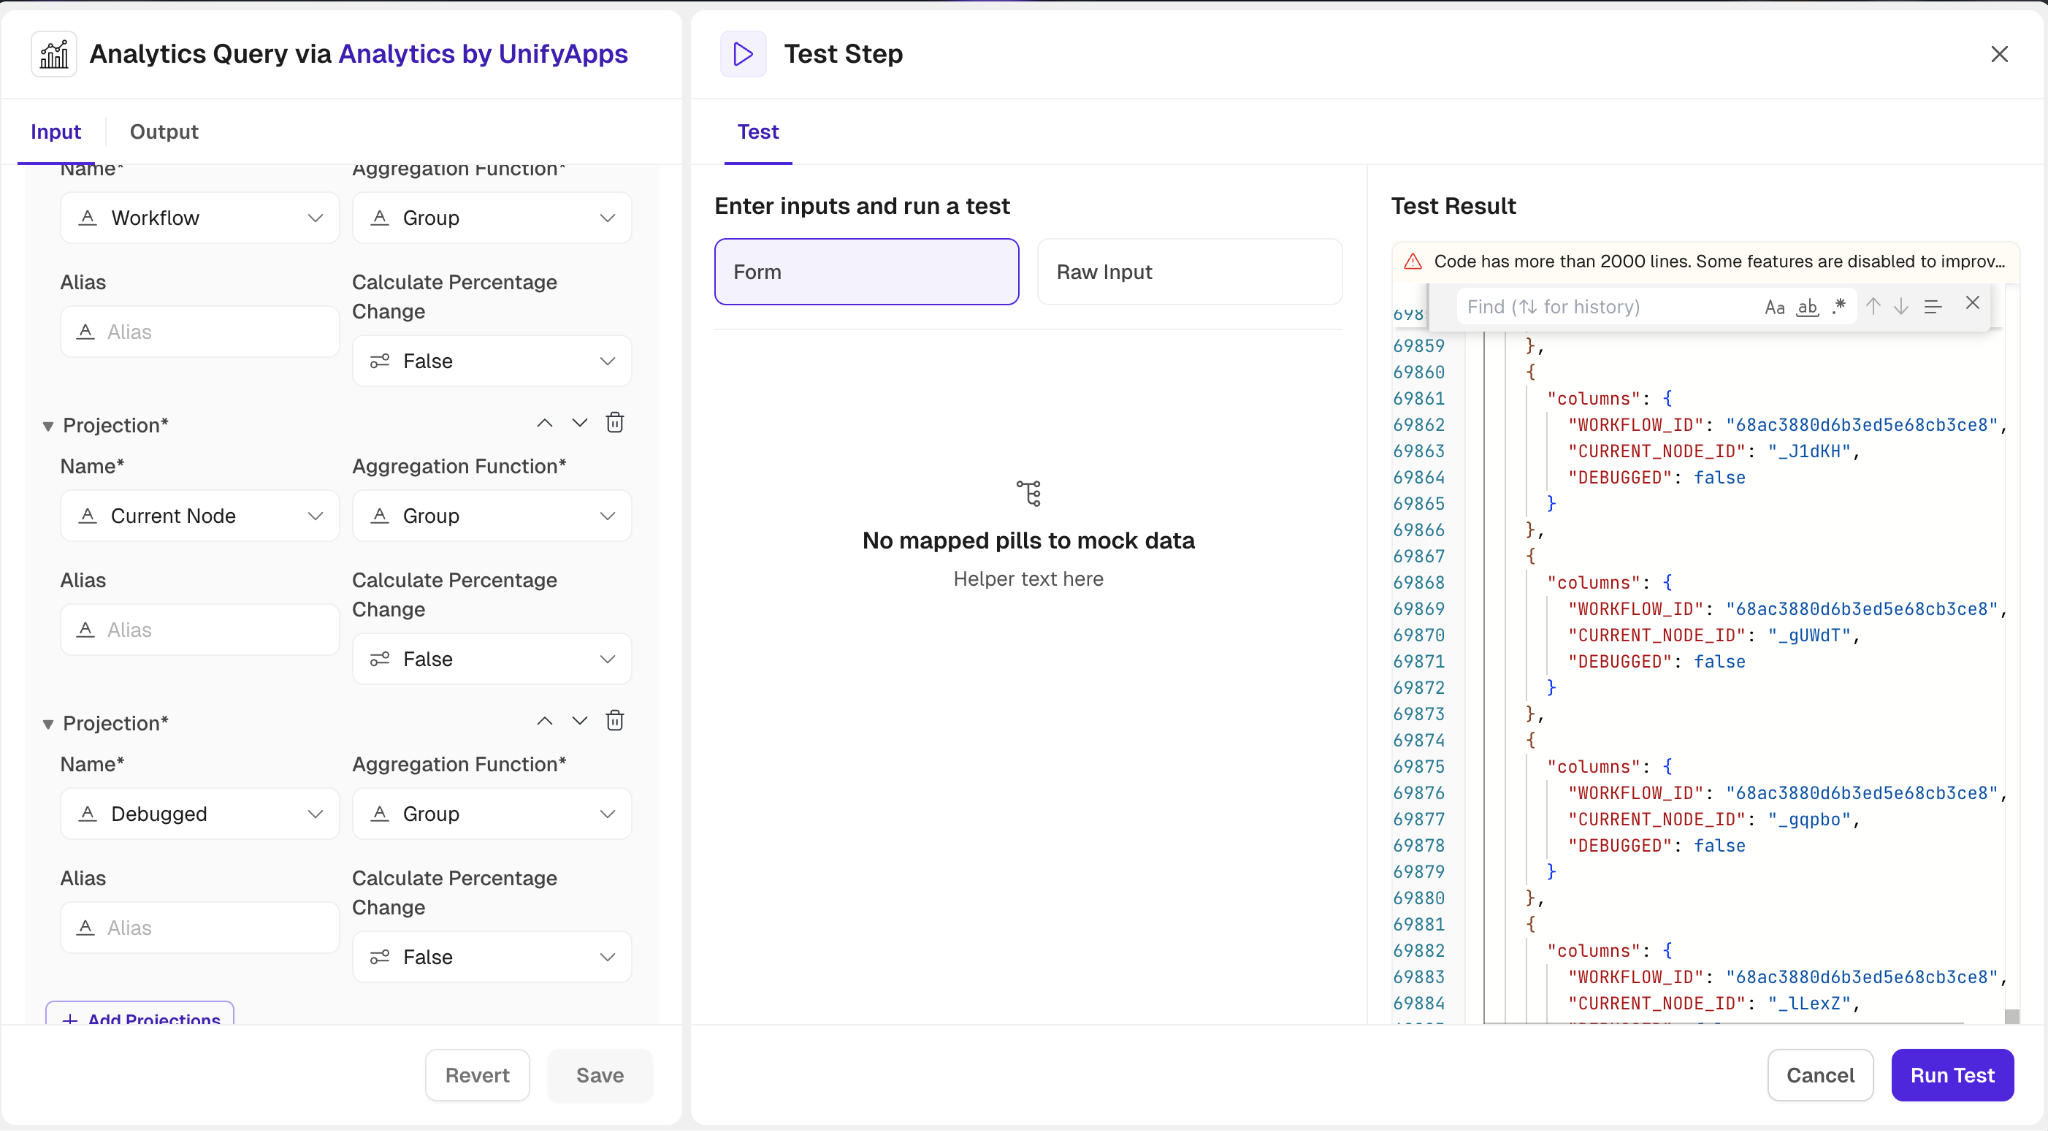
Node Level Reporting
Id : Unique identifier for the node execution instance.
2. Execution Instance Id : Identifier for the specific execution instance of the workflow.
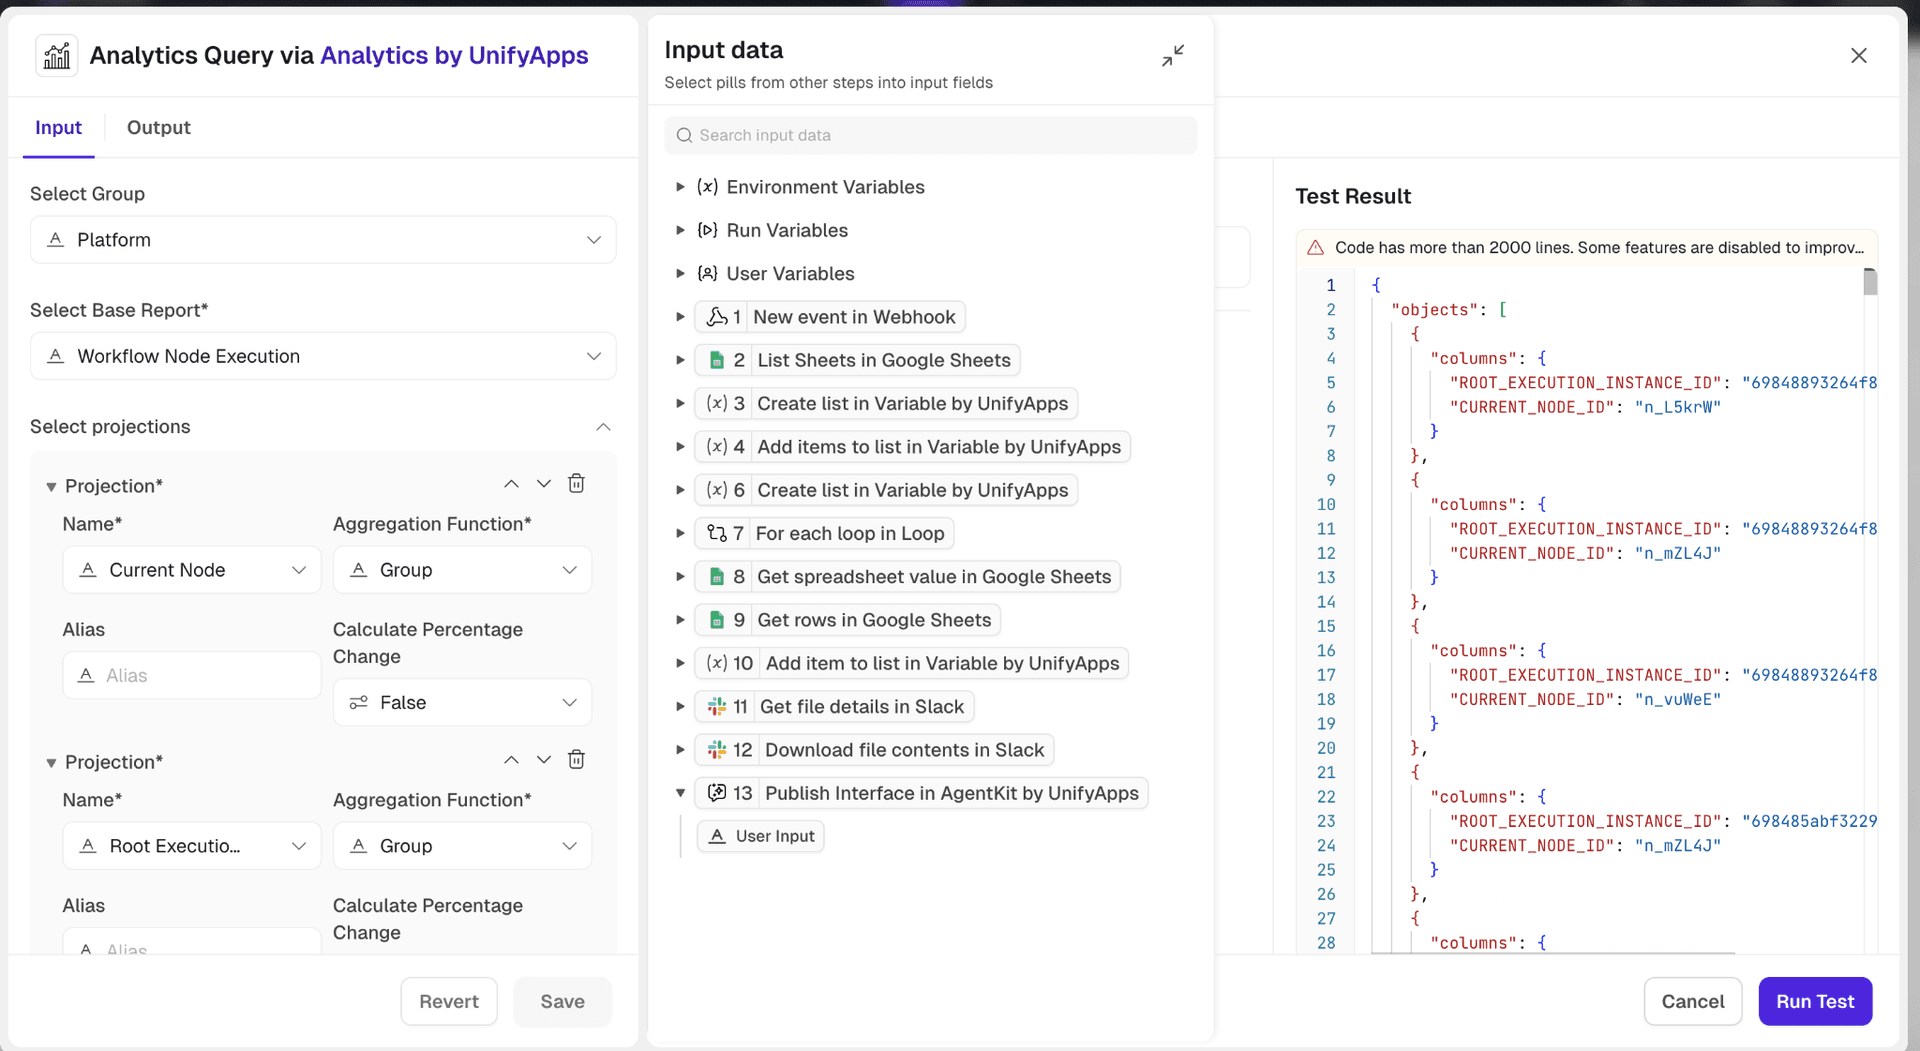
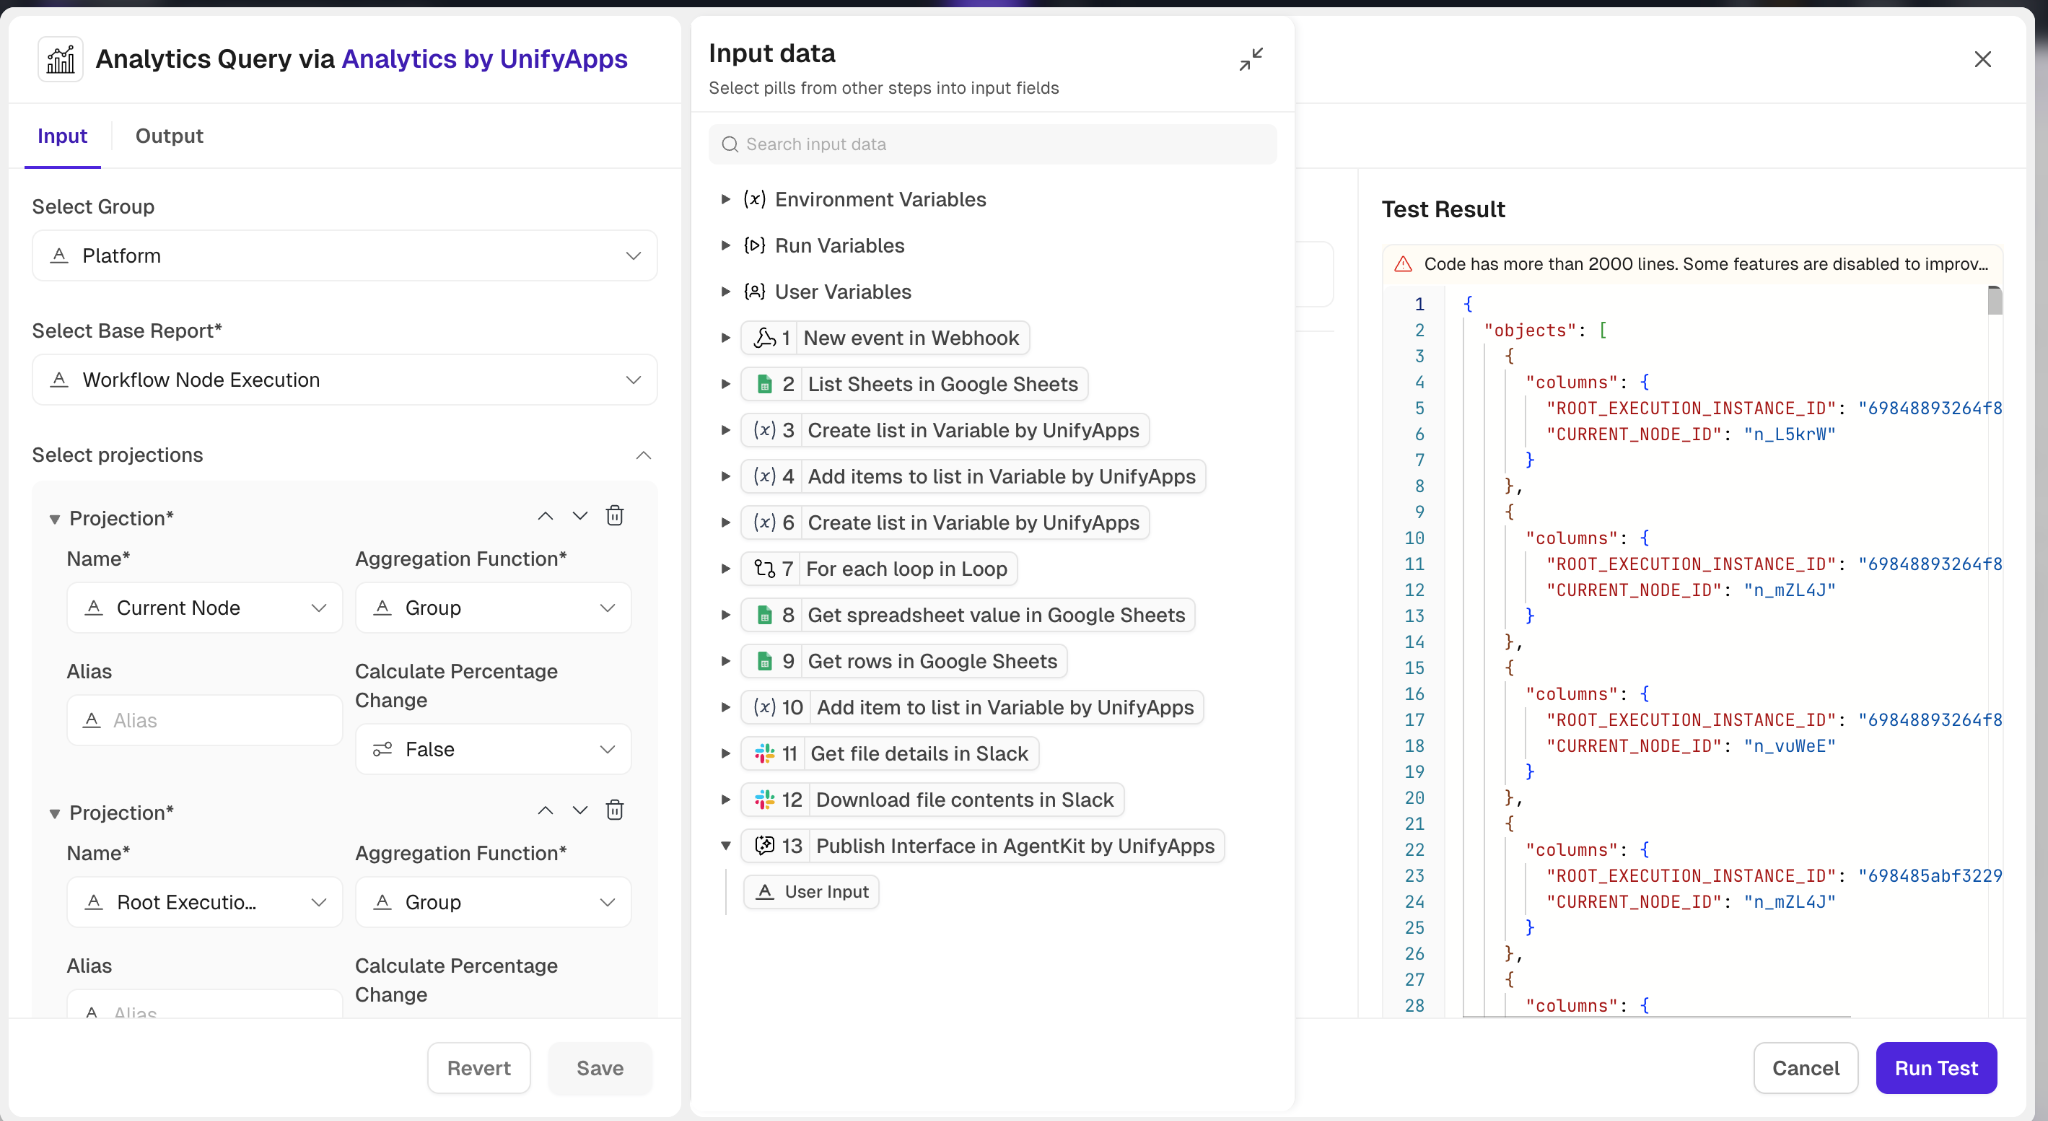
3. Root Execution Instance Id : Identifier for the root execution instance of the workflow, useful for tracking nested executions.
4. Parent Execution Instance Id : Identifier for the parent execution instance, if applicable.
5. Trigger Instance Id : Identifier for the trigger instance that initiated the workflow execution.
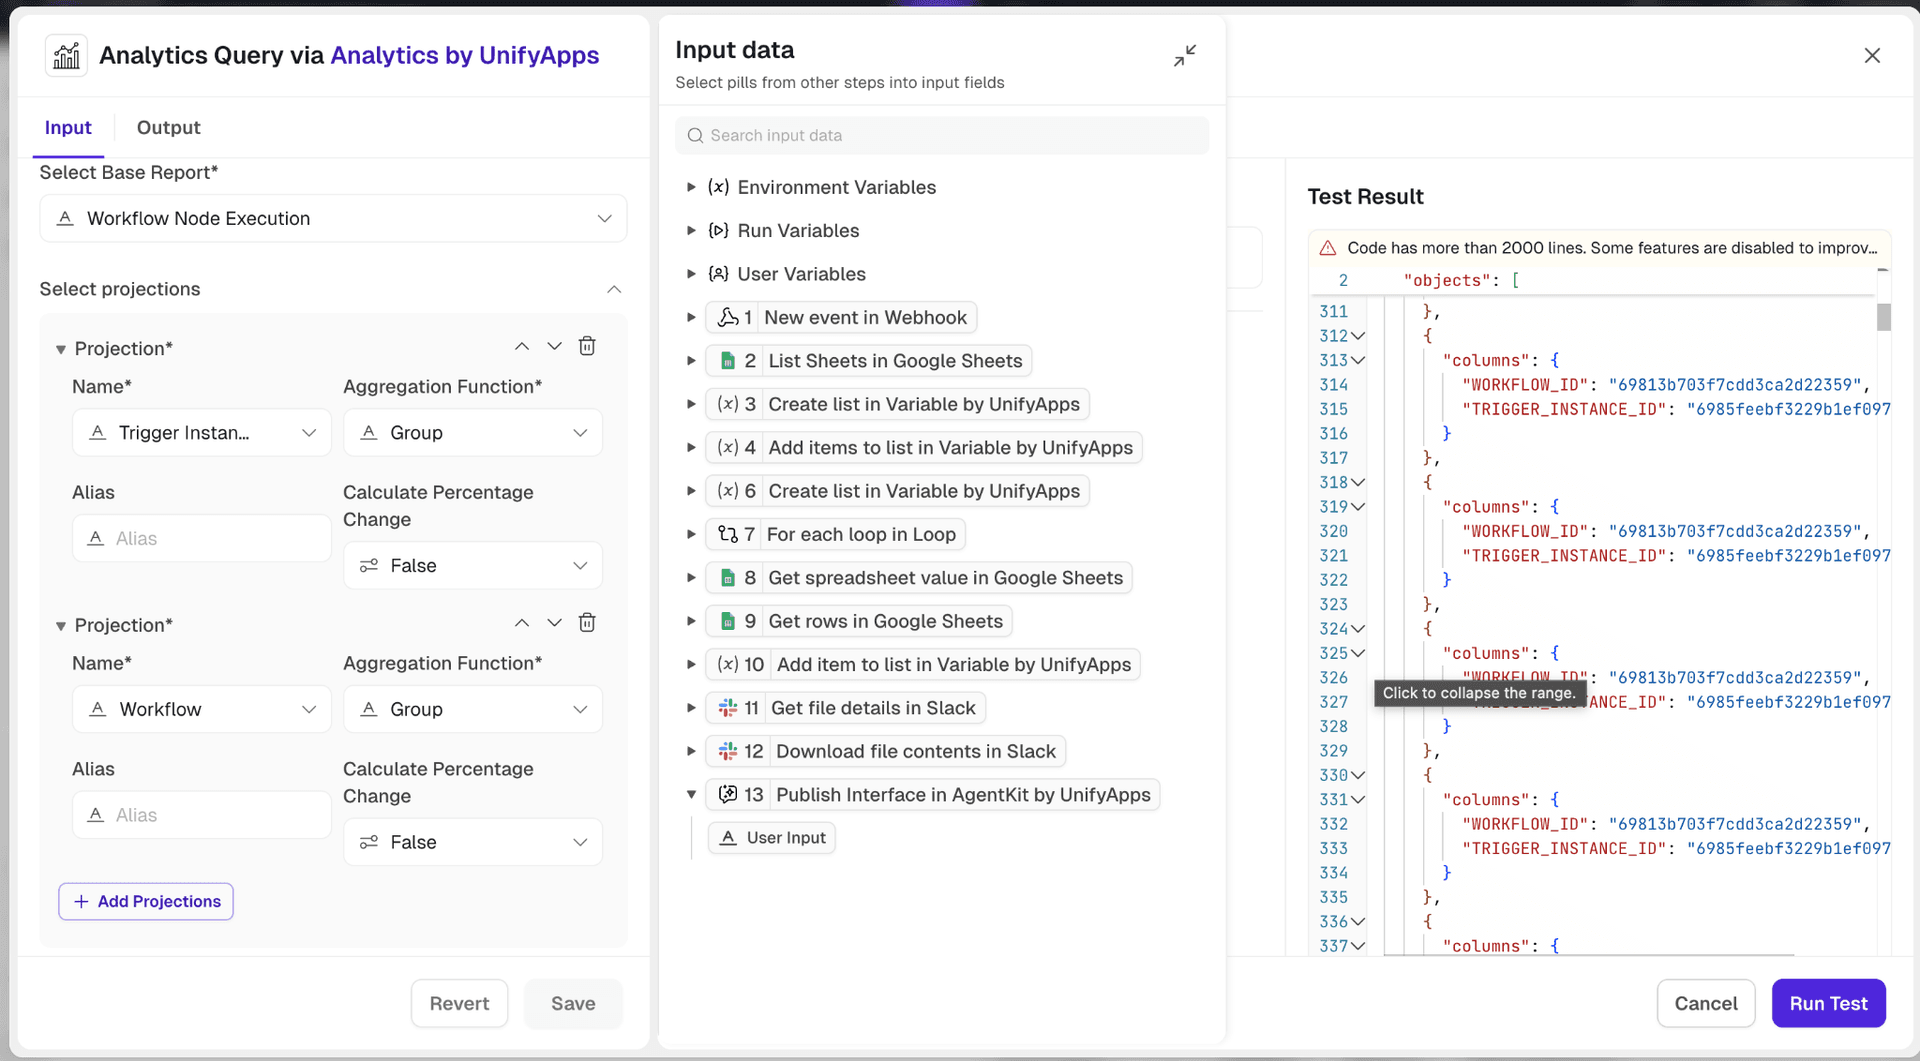
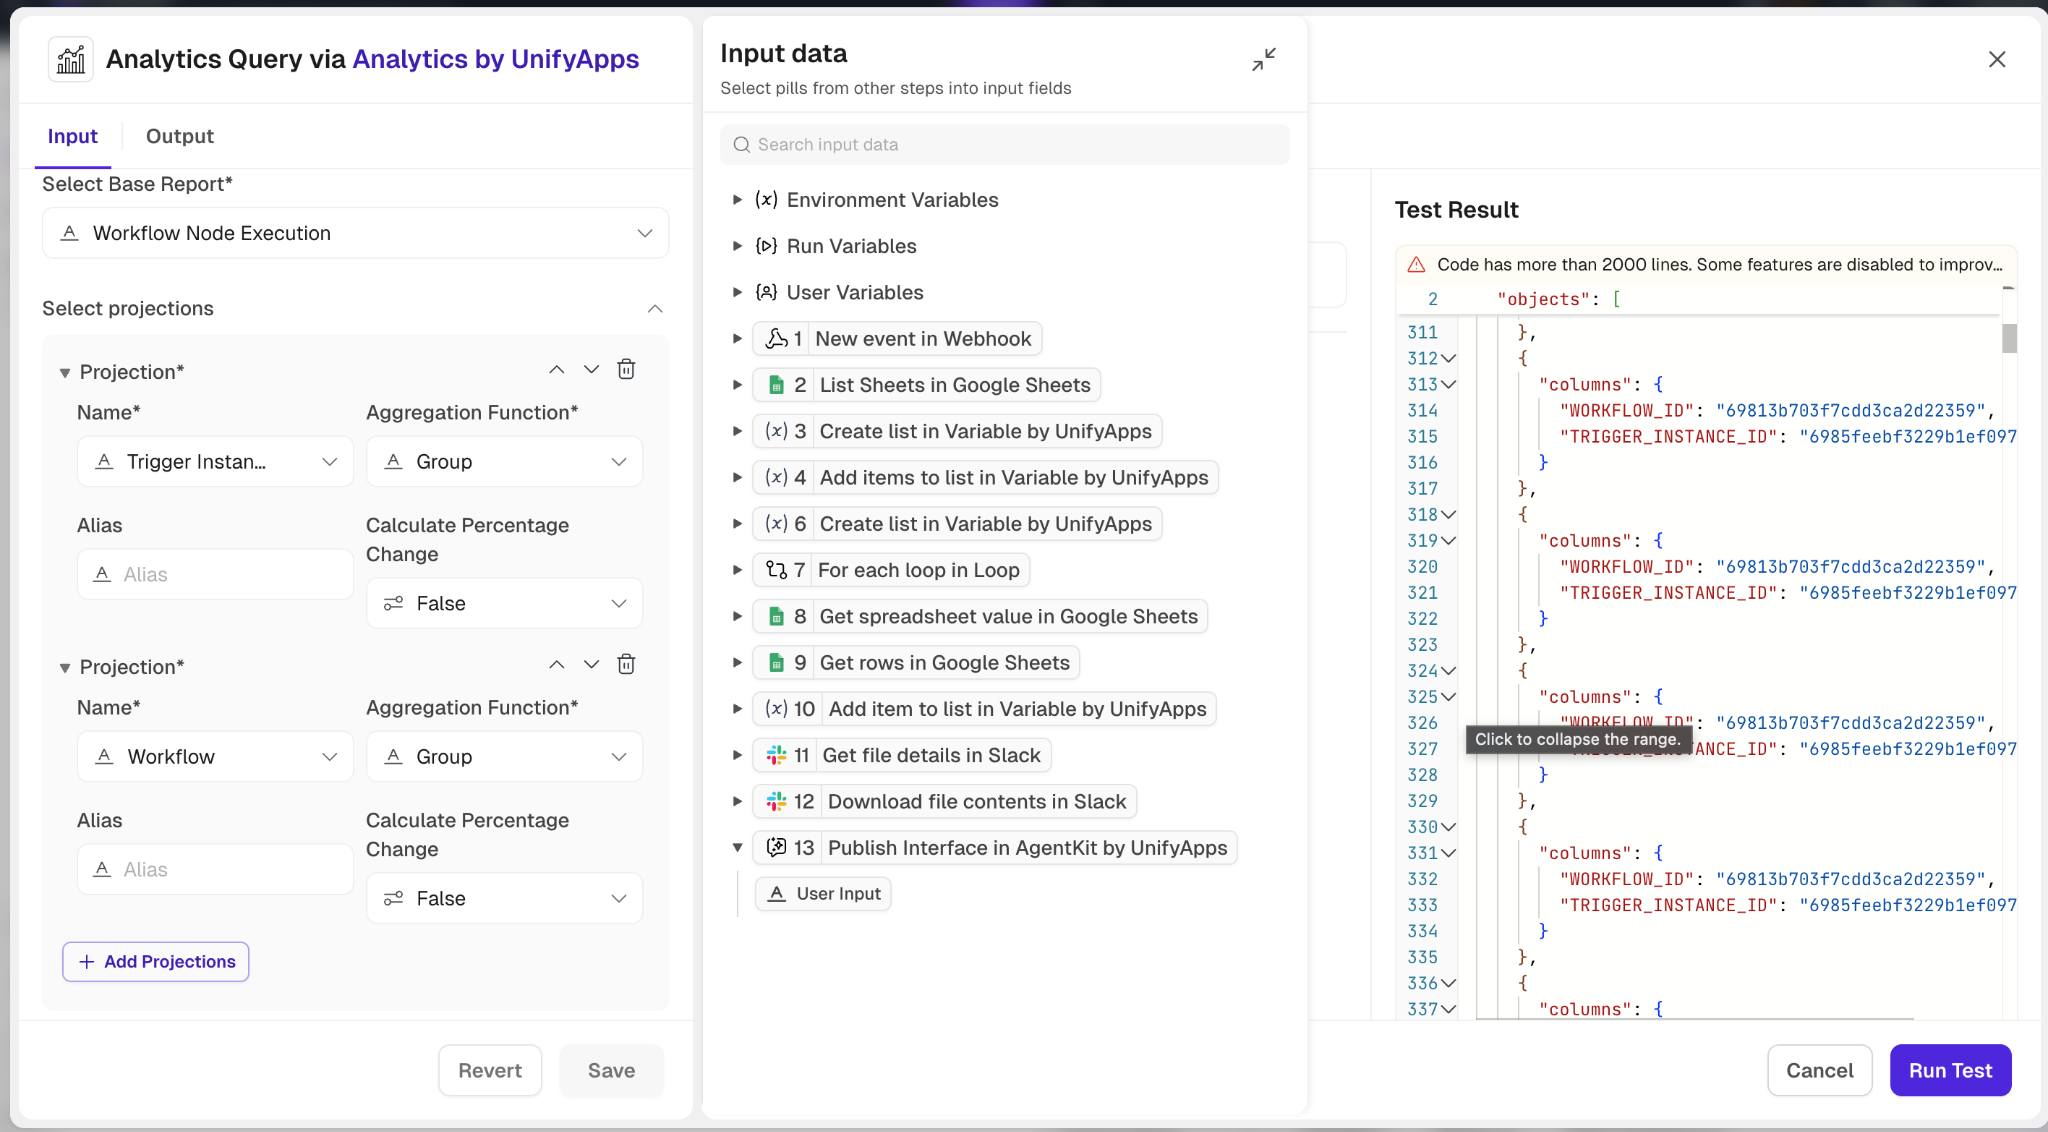
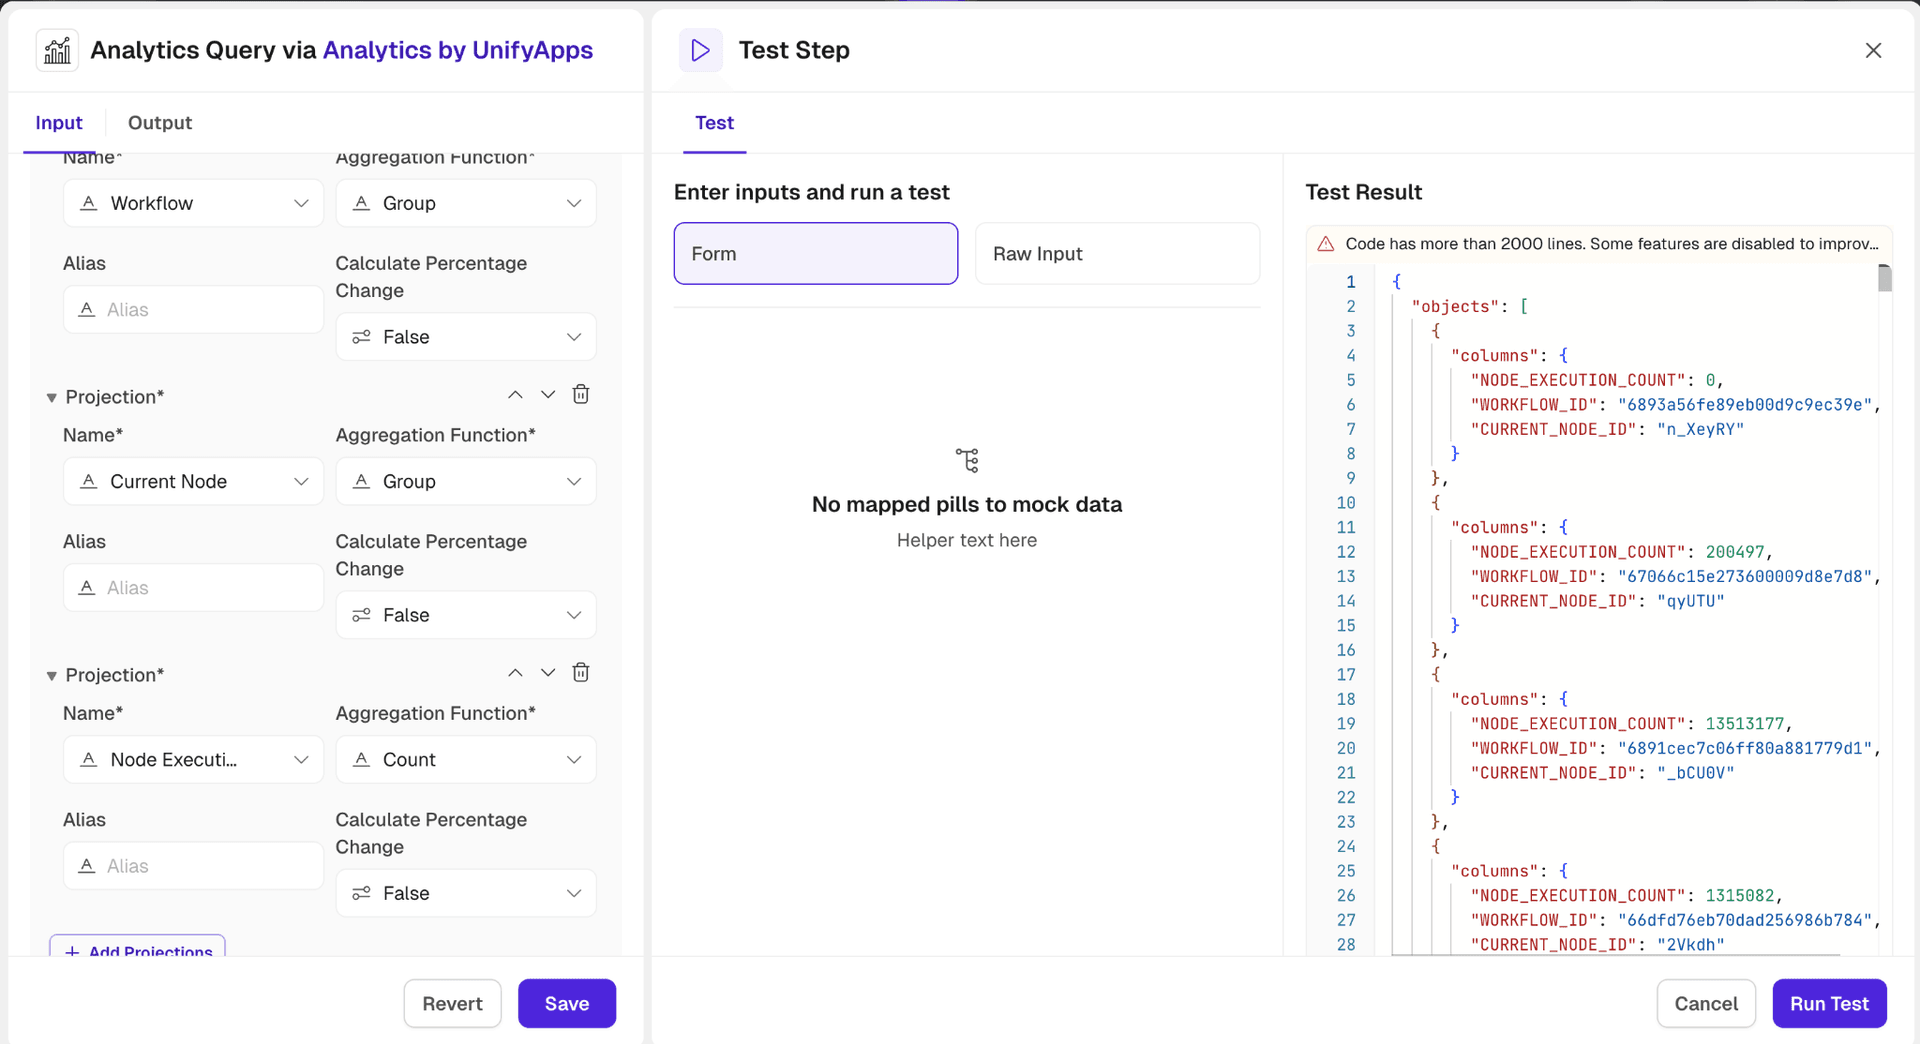
6. Workflow : Name or identifier of the workflow being executed.
7. Workflow Version : Version of the workflow being executed.
8. Deployed Workflow : Identifier for the deployed version of the workflow.
9. Concurrent Execution : Indicates whether the node execution is part of a concurrent execution path.
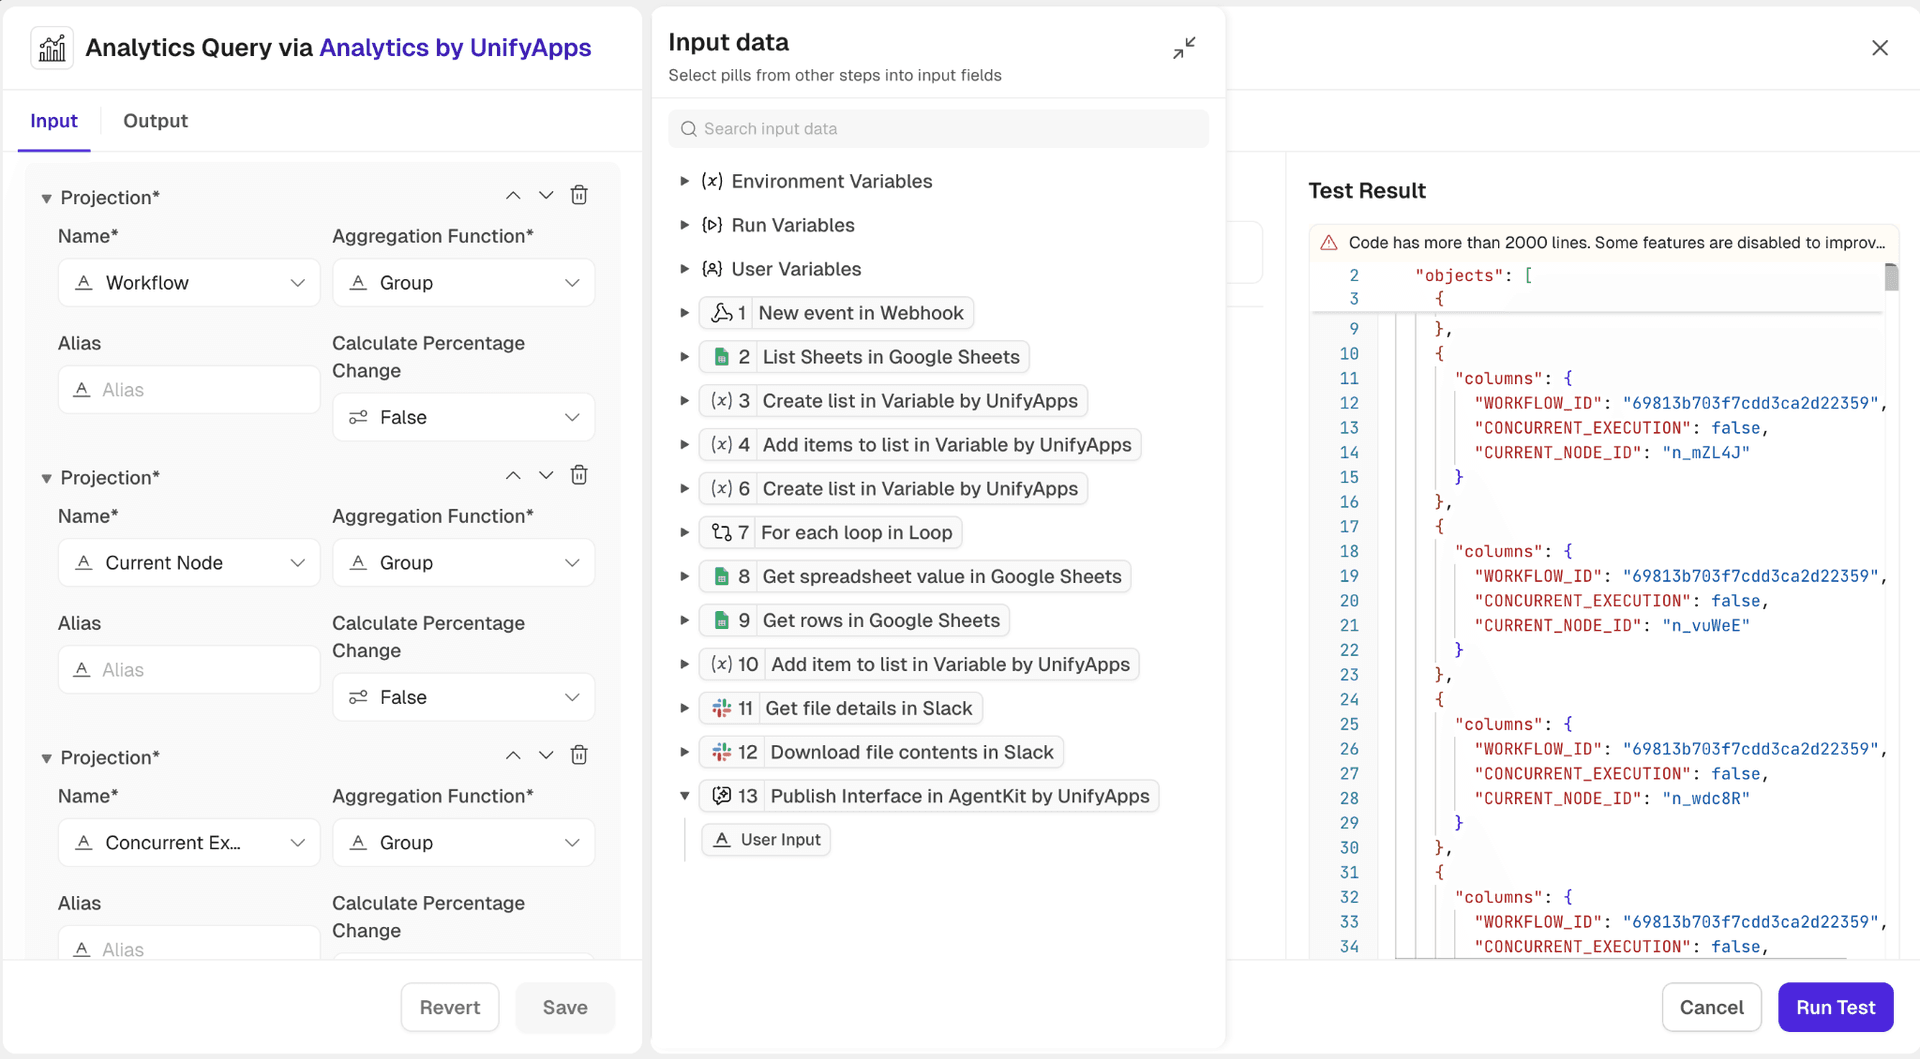
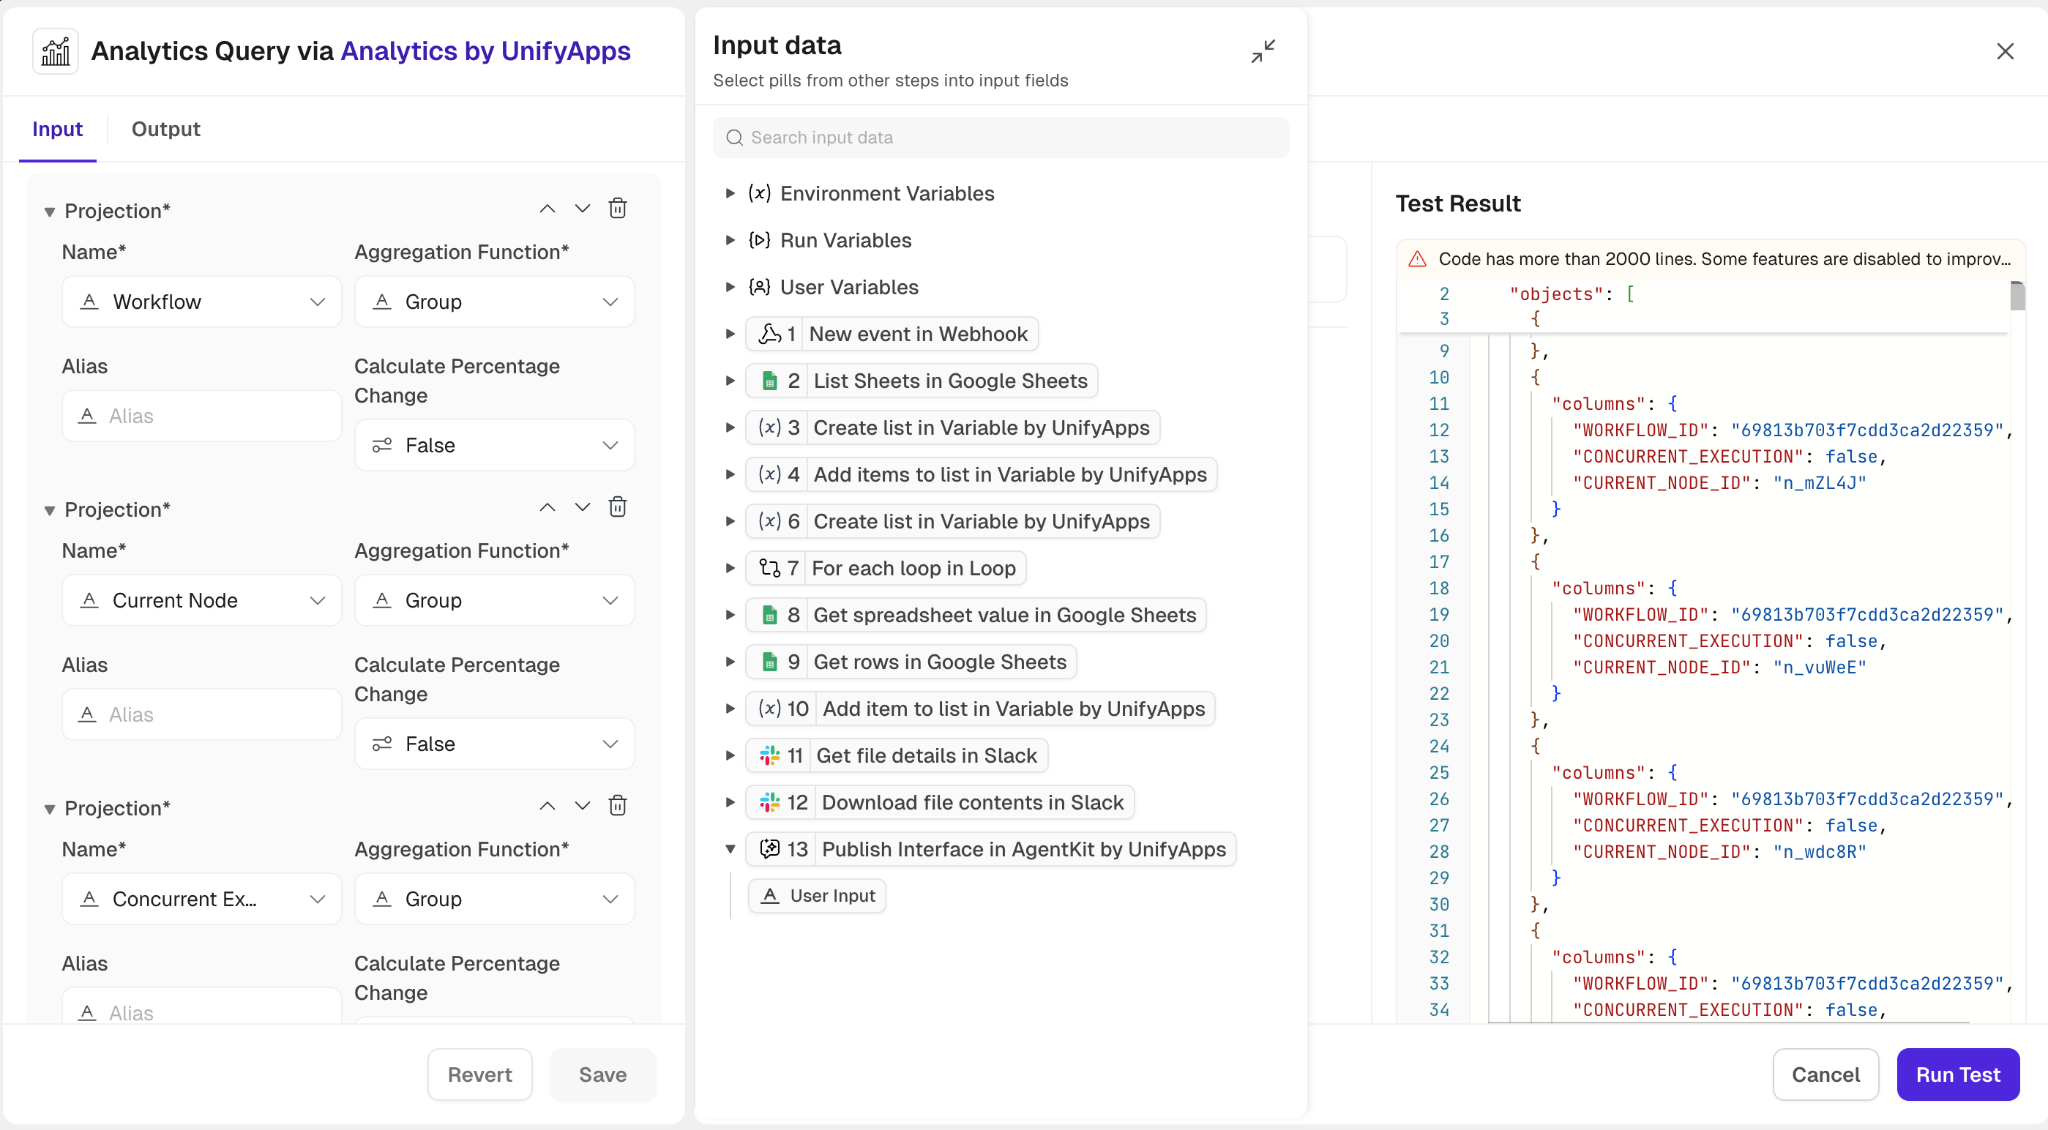
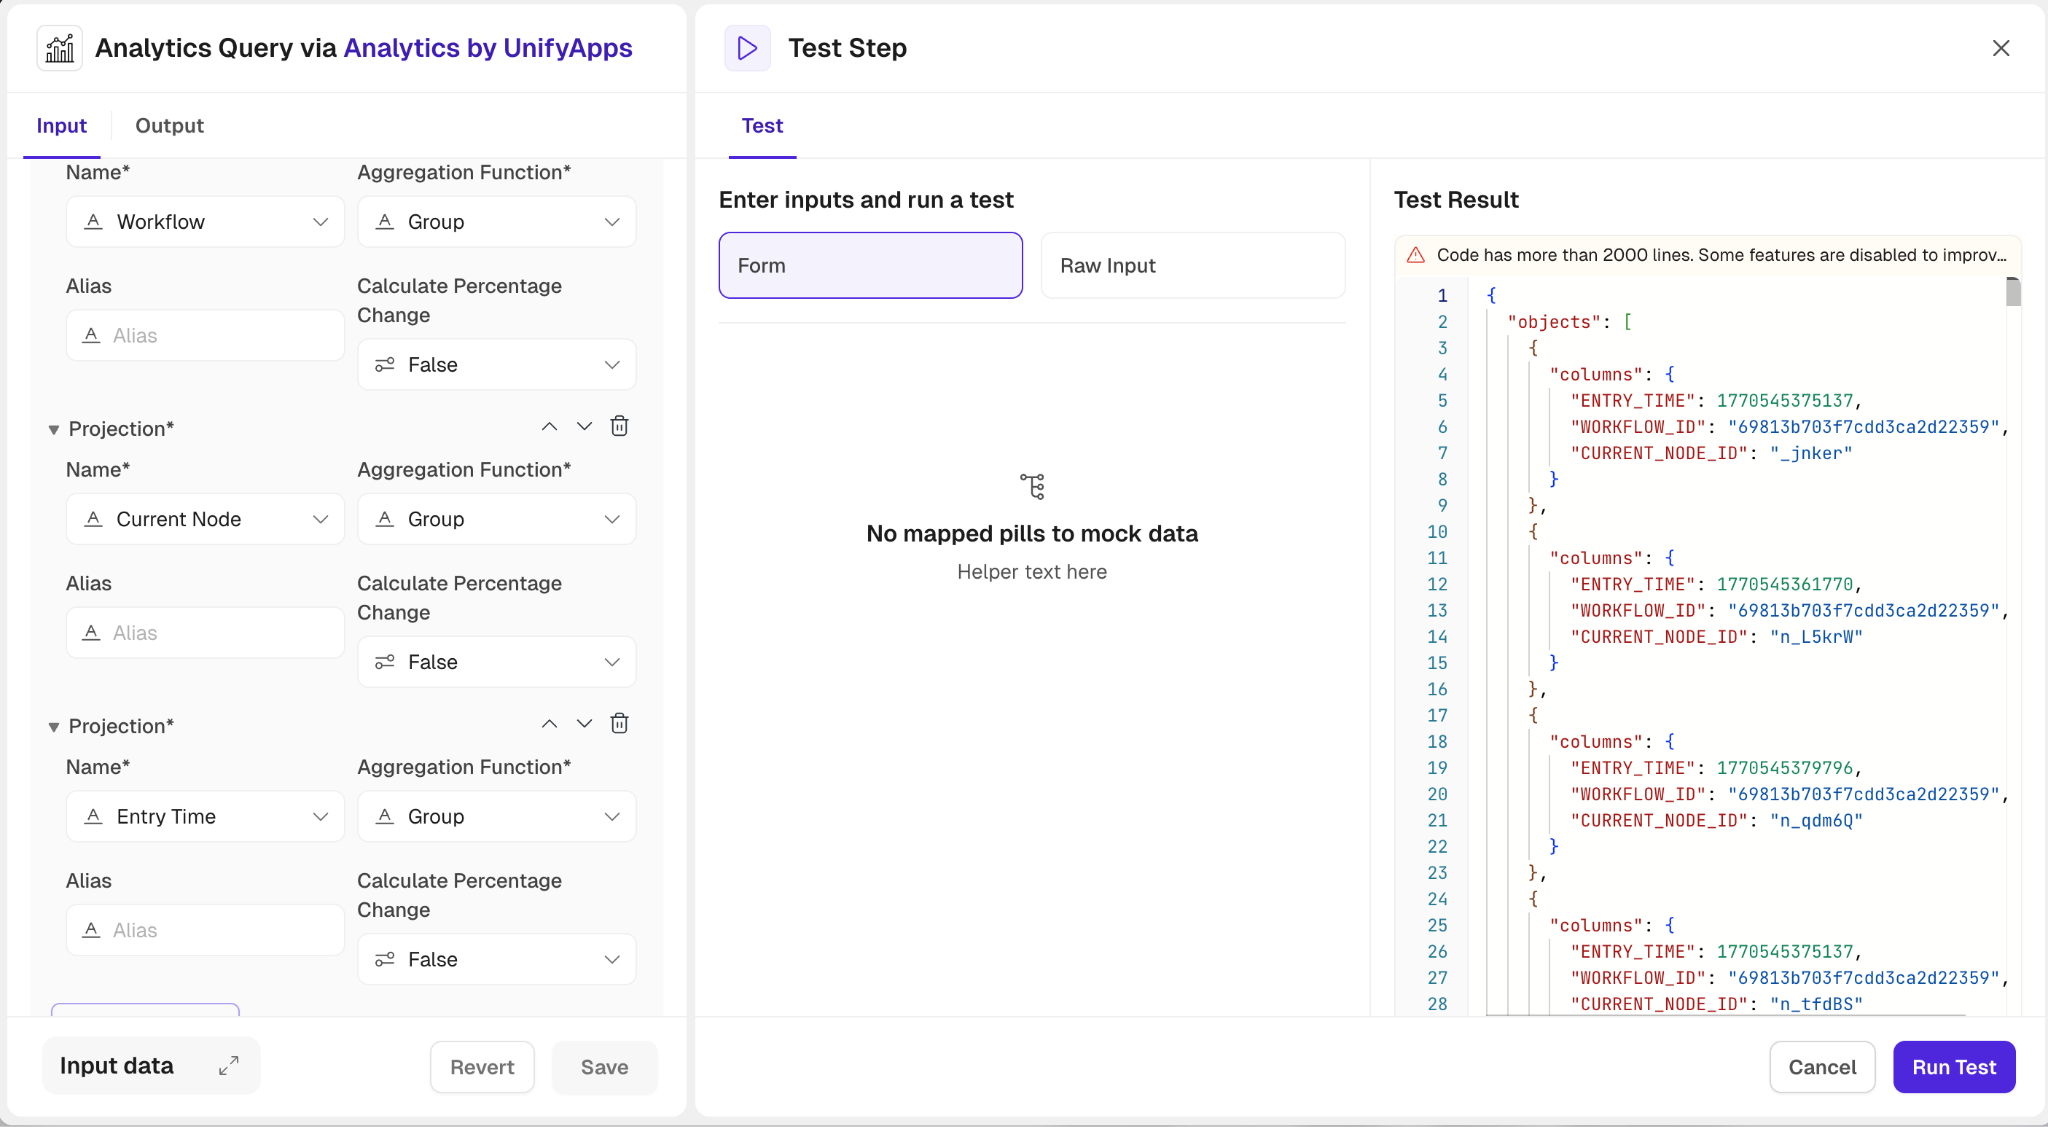
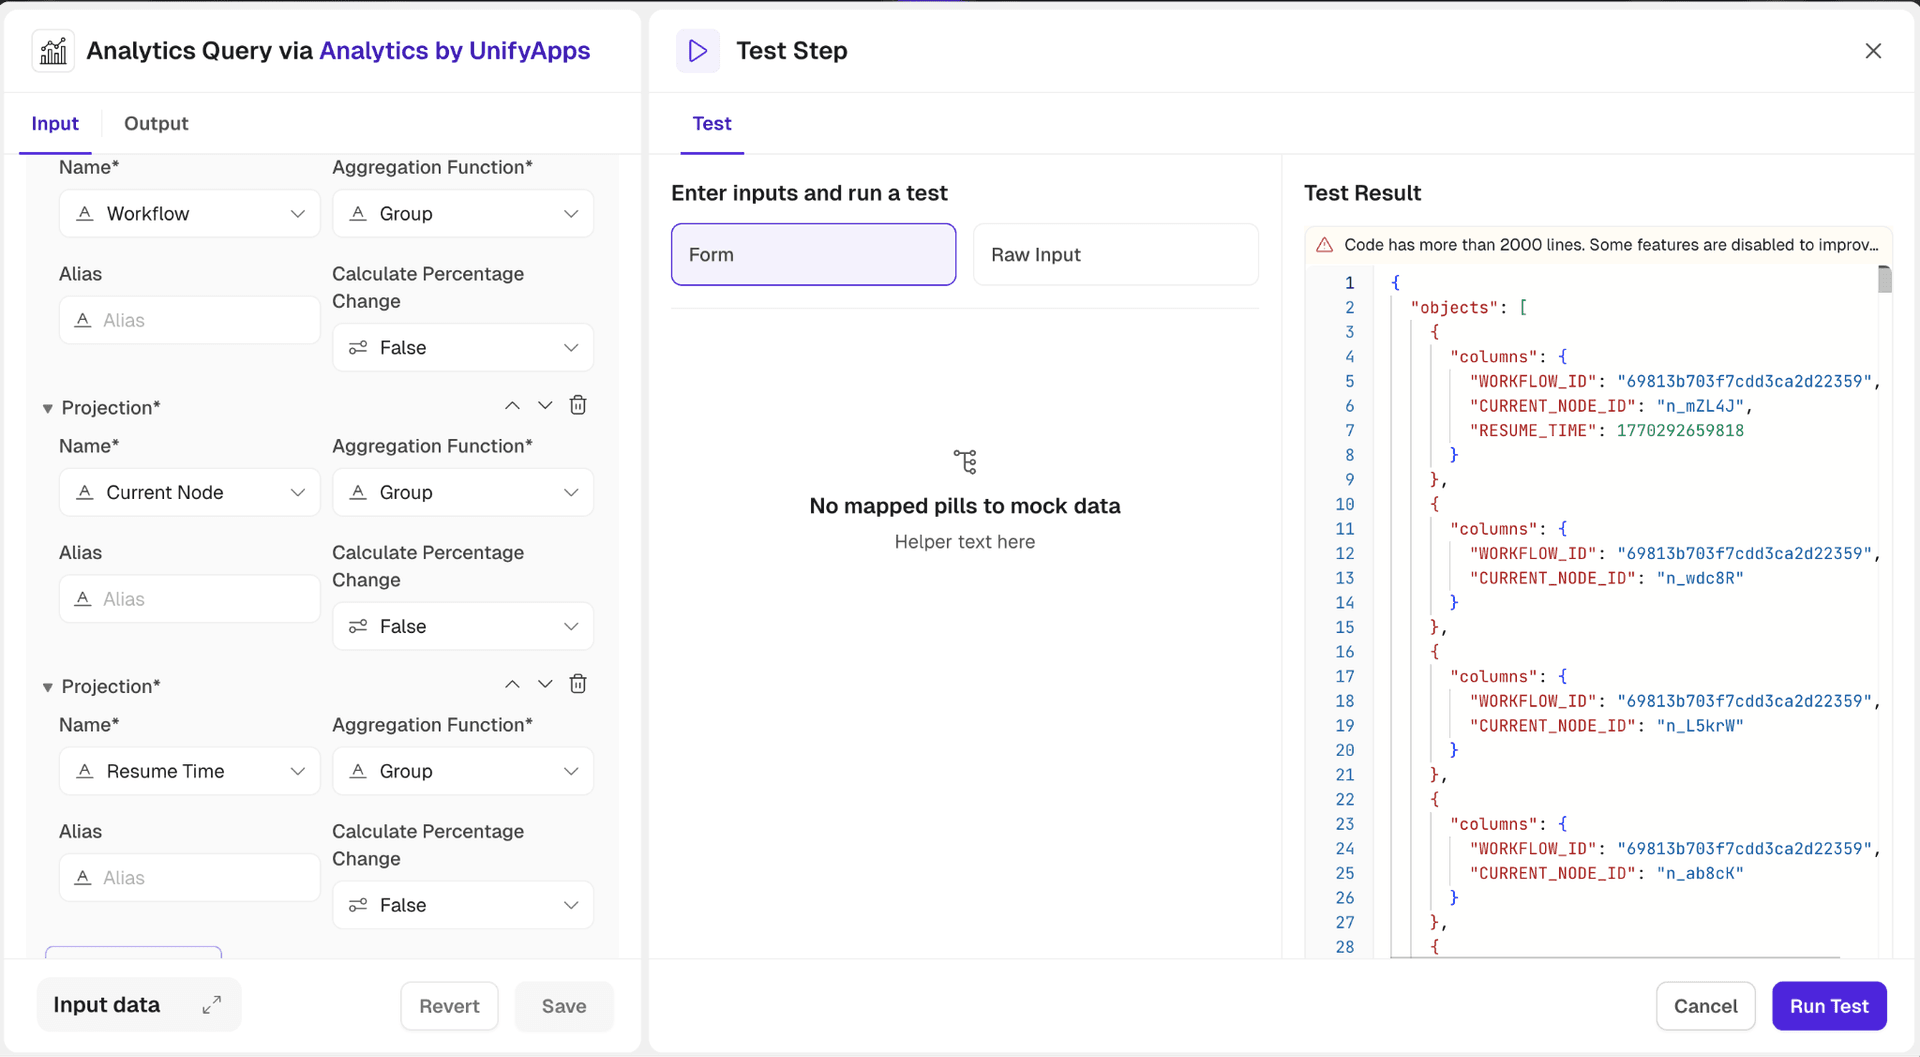
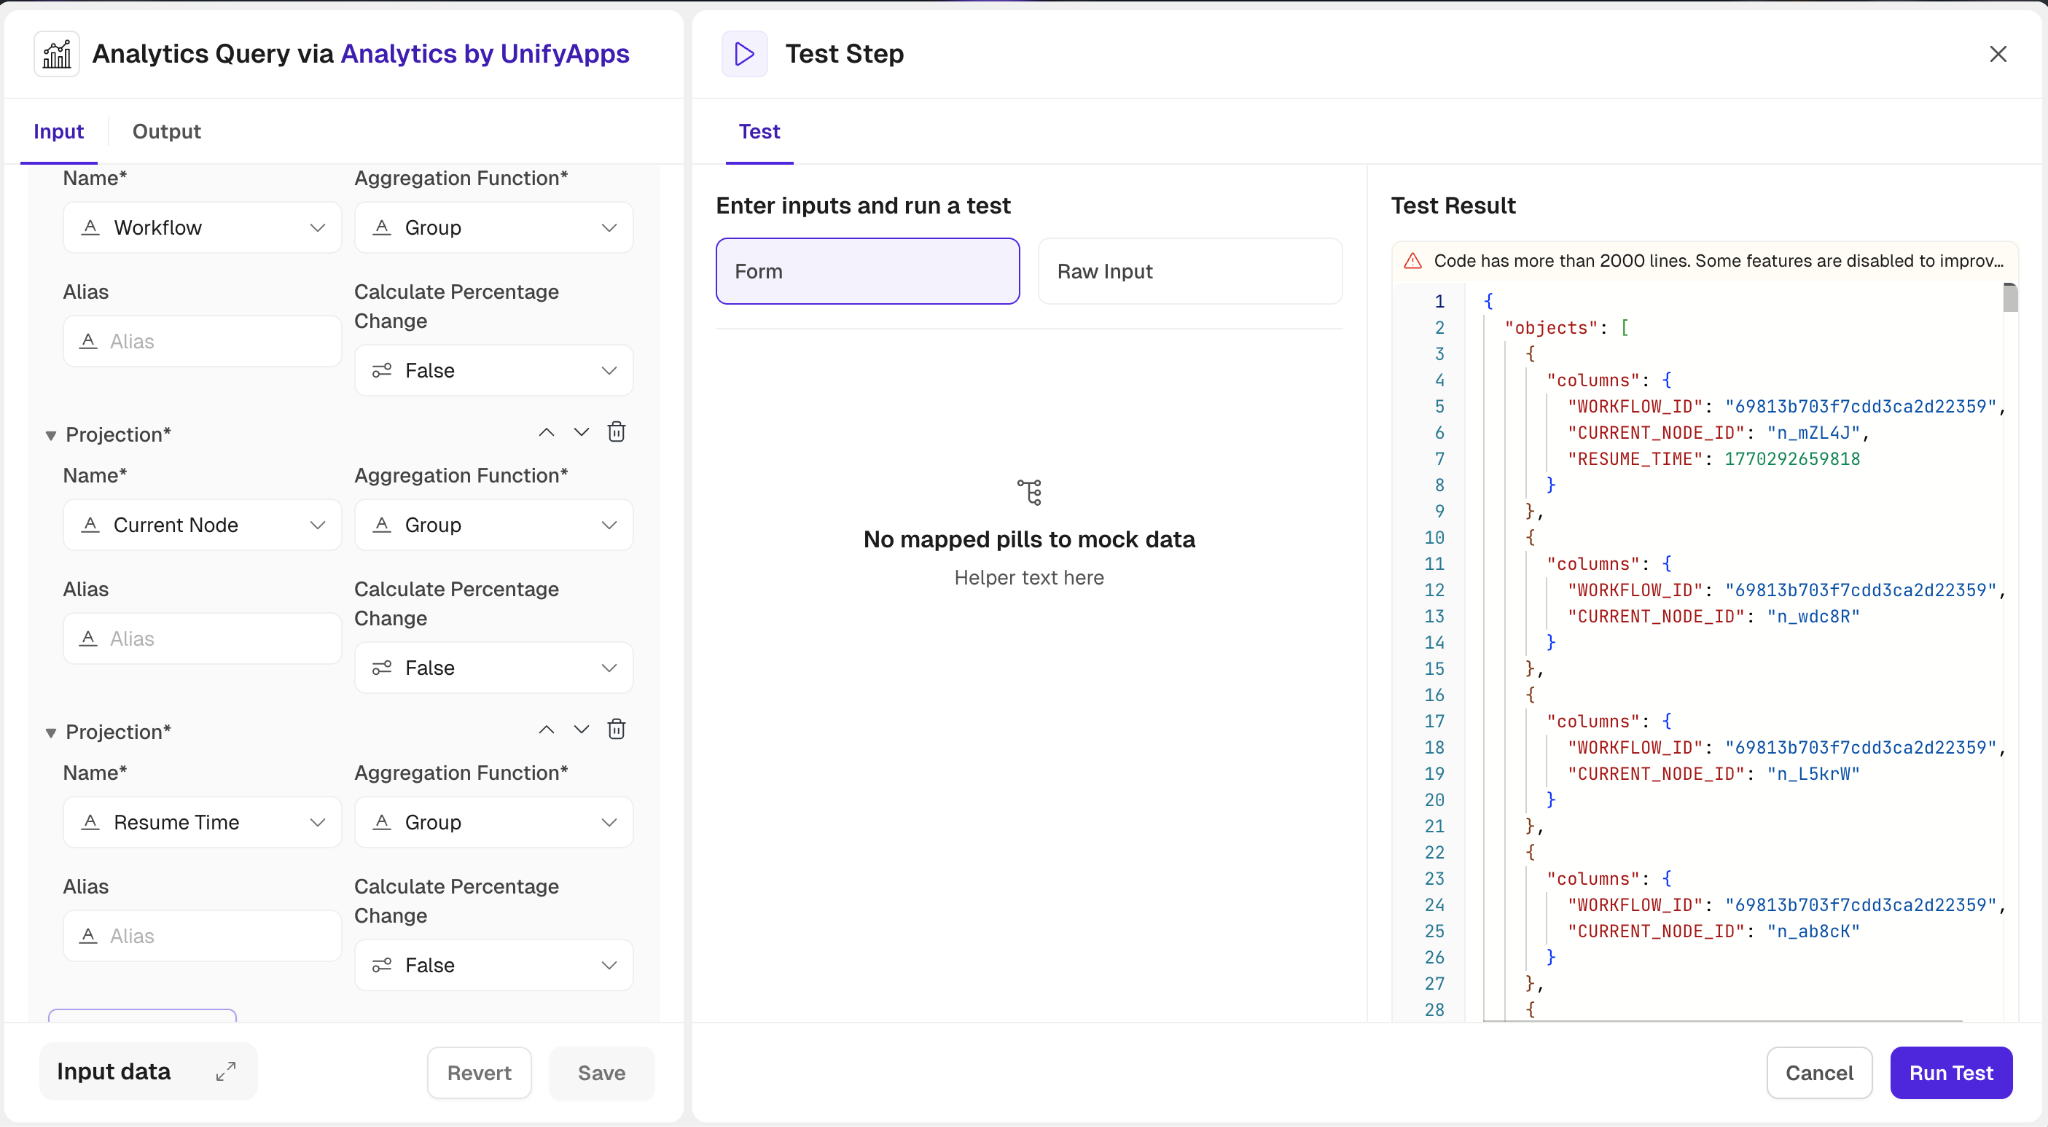
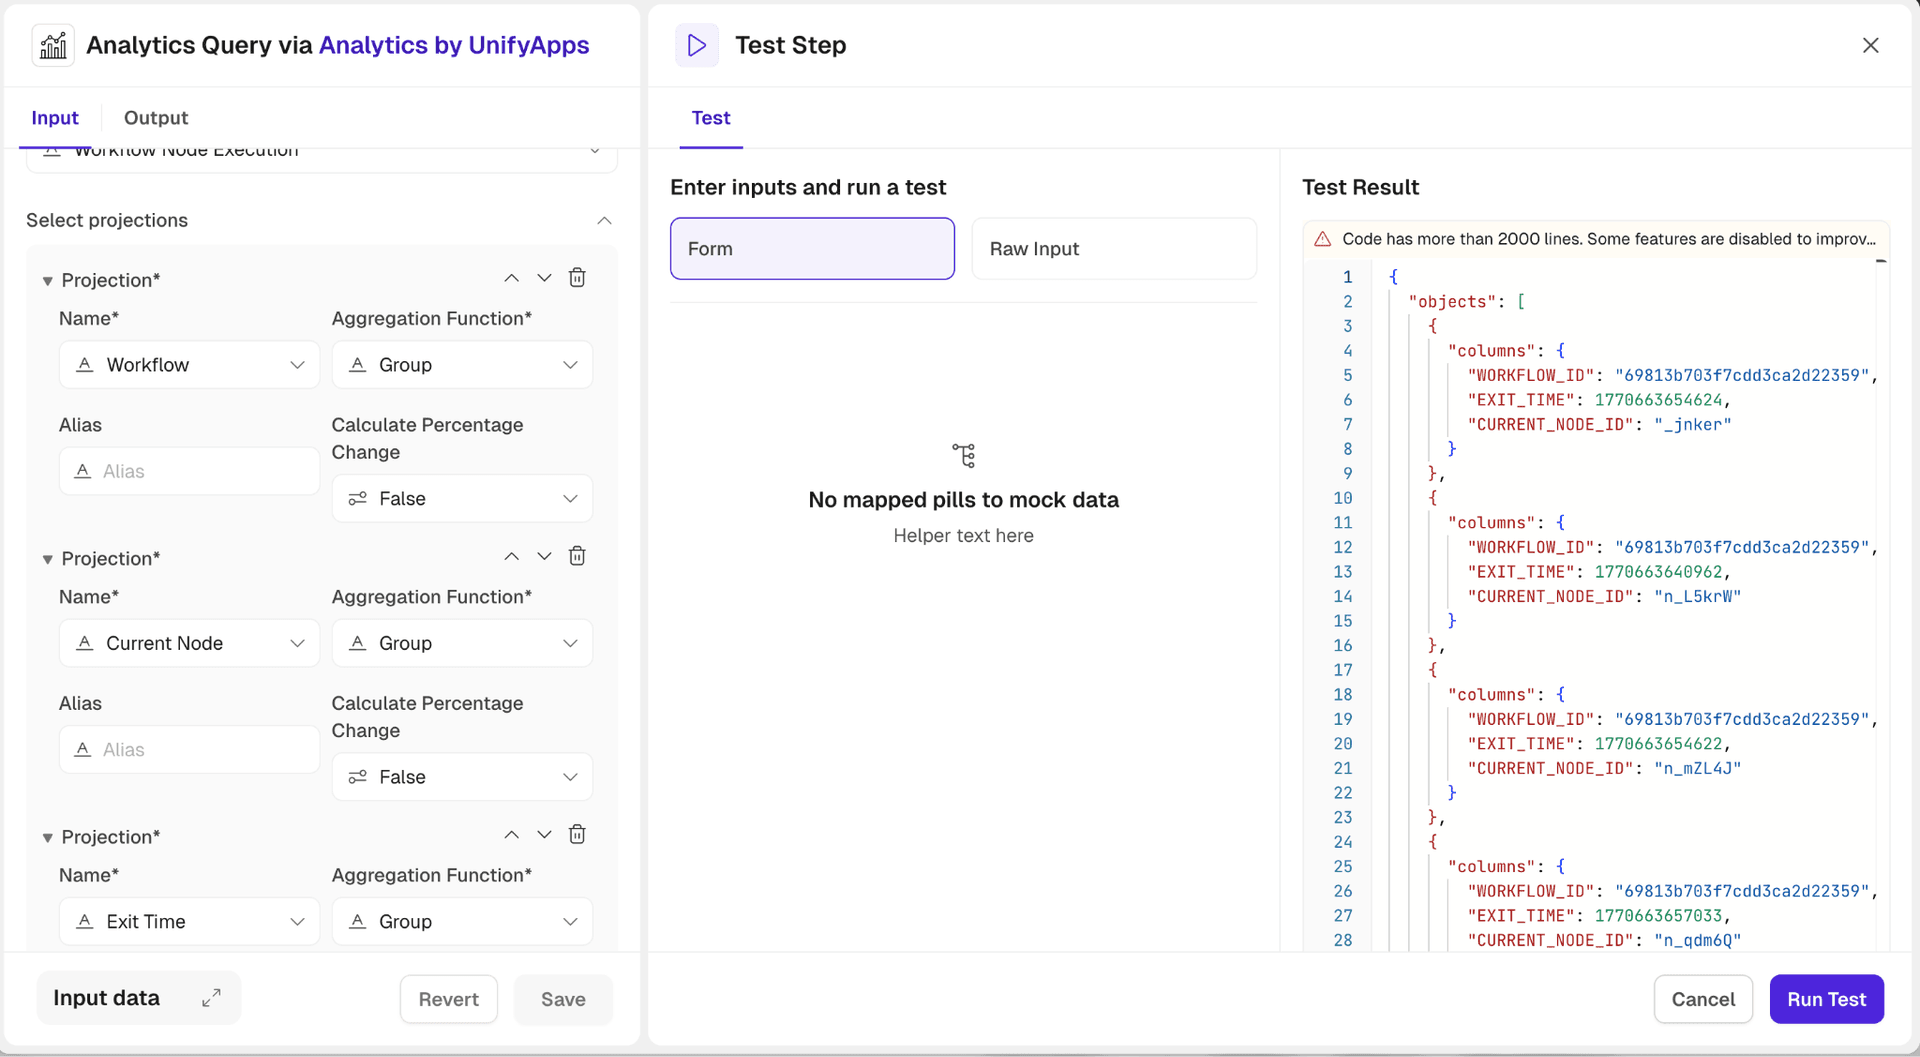
10. Current Node : Name or identifier of the current node being executed.
11. Current Node App Name : Name of the application associated with the current node.
12. Current Node Resource Name : Name of the resource associated with the current node.
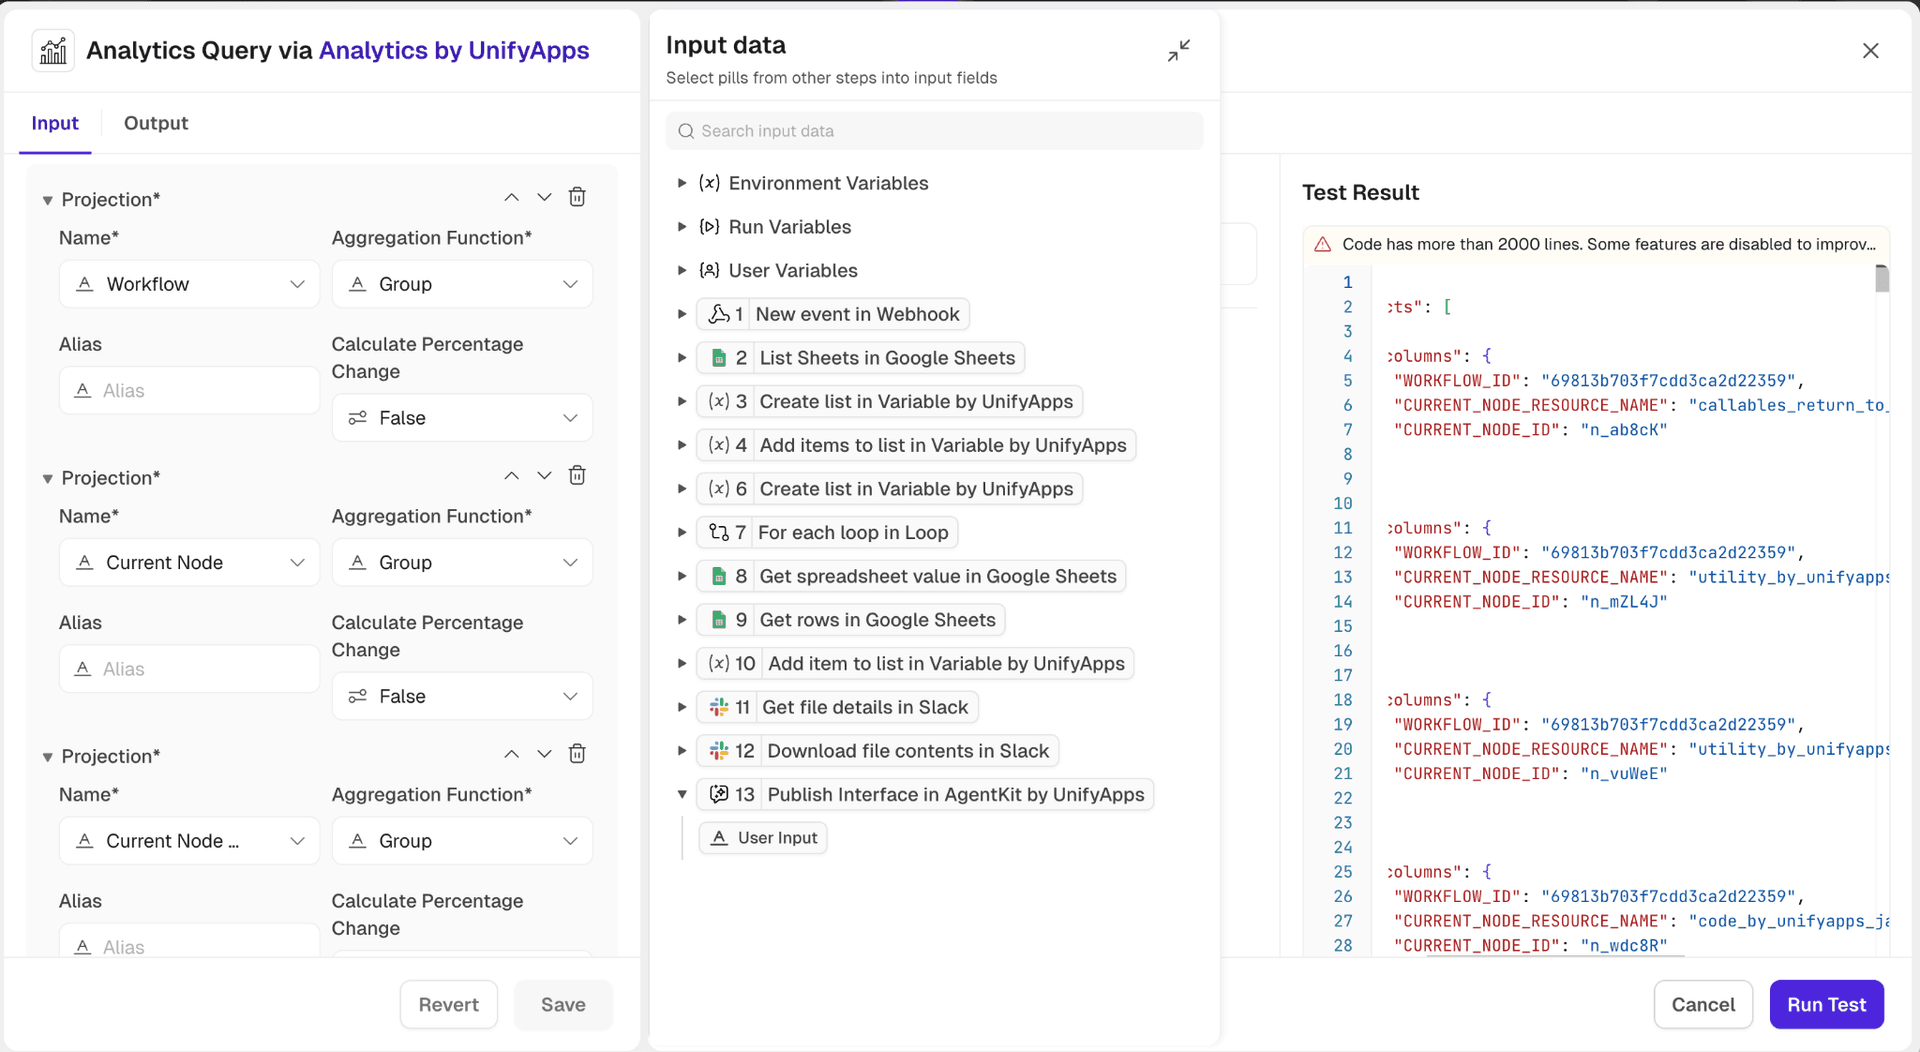
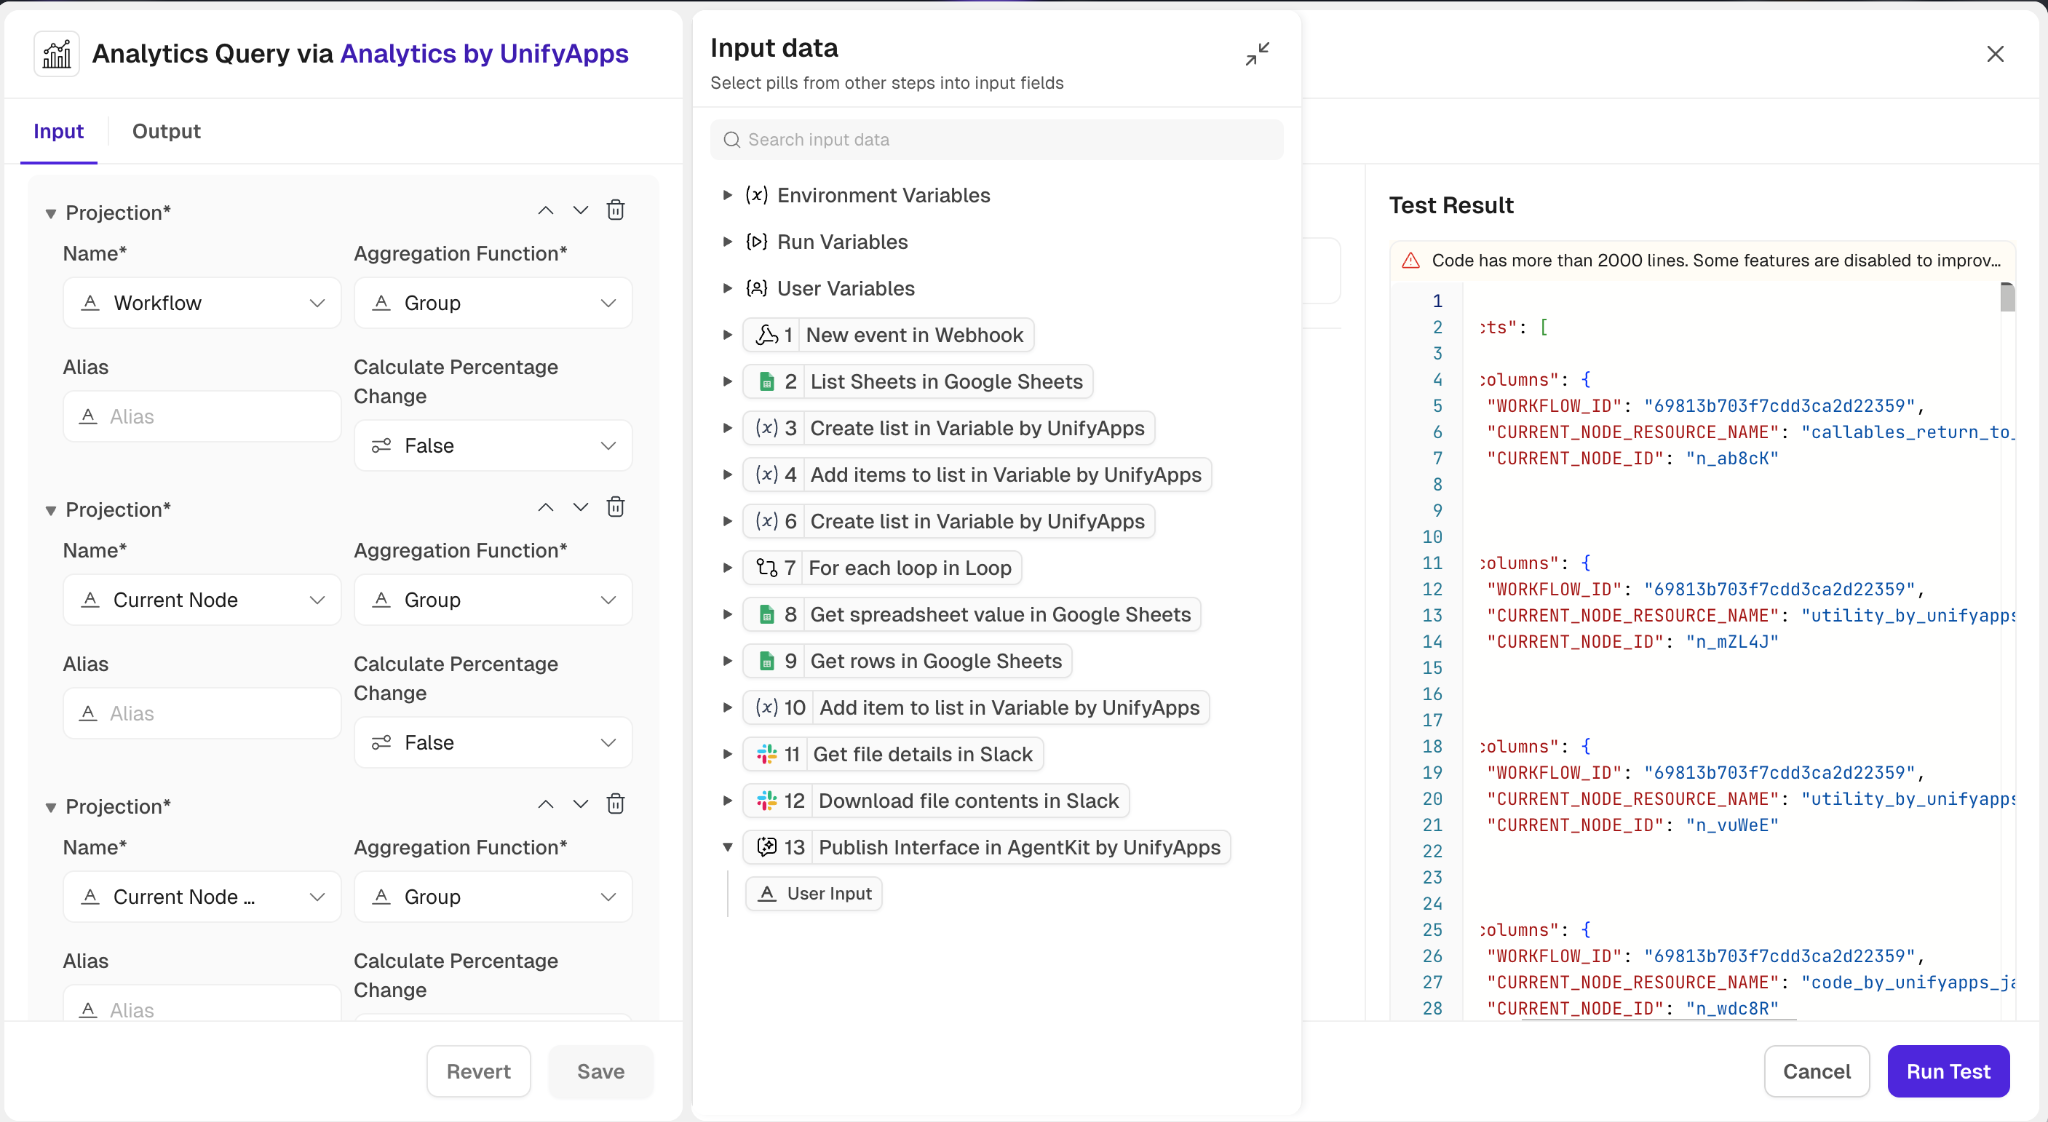
13. Current Node Connection Id : Identifier for the connection being executed for the current node.
14. Next Node : Name or identifier of the next node to be executed.
15. Previous Node : Name or identifier of the previous node that was executed.

16. Entry Time : Timestamp when the node execution started.
17. Resume Time : Timestamp when the node execution resumed after being paused or waiting.
18. Exit Time : Timestamp when the node execution completed or exited.
19. Status : Current status of the node execution (e.g., RUNNING, COMPLETED, FAILED).
20. Execution Time Hour of Day : Hour of the day when the node execution started, useful for time-based analysis.
21. Execution Time Day of Week : Day of the week when the node execution started, useful for identifying patterns based on days.
22. Wait Time : Total time the node execution spent waiting (e.g., for resources, external calls).
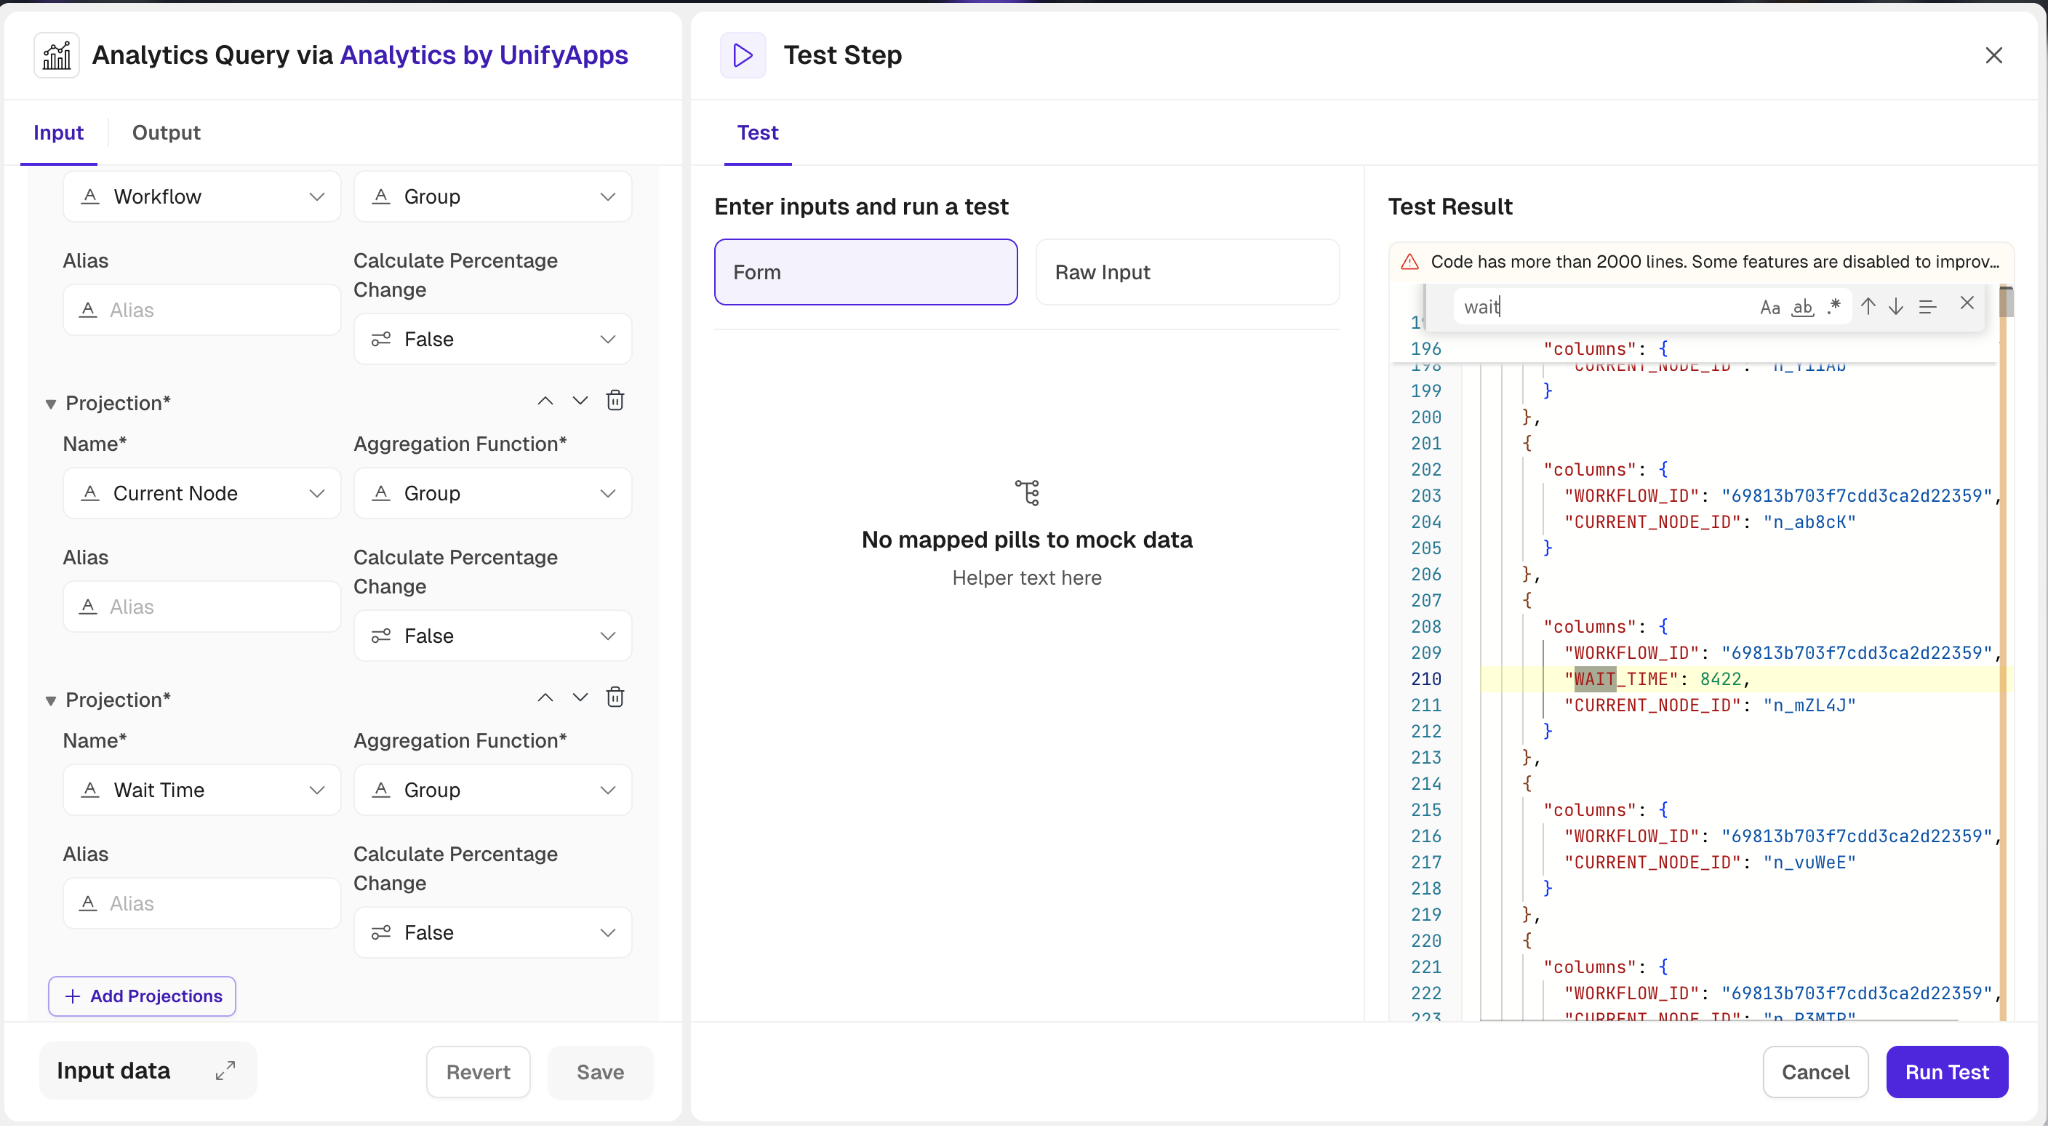
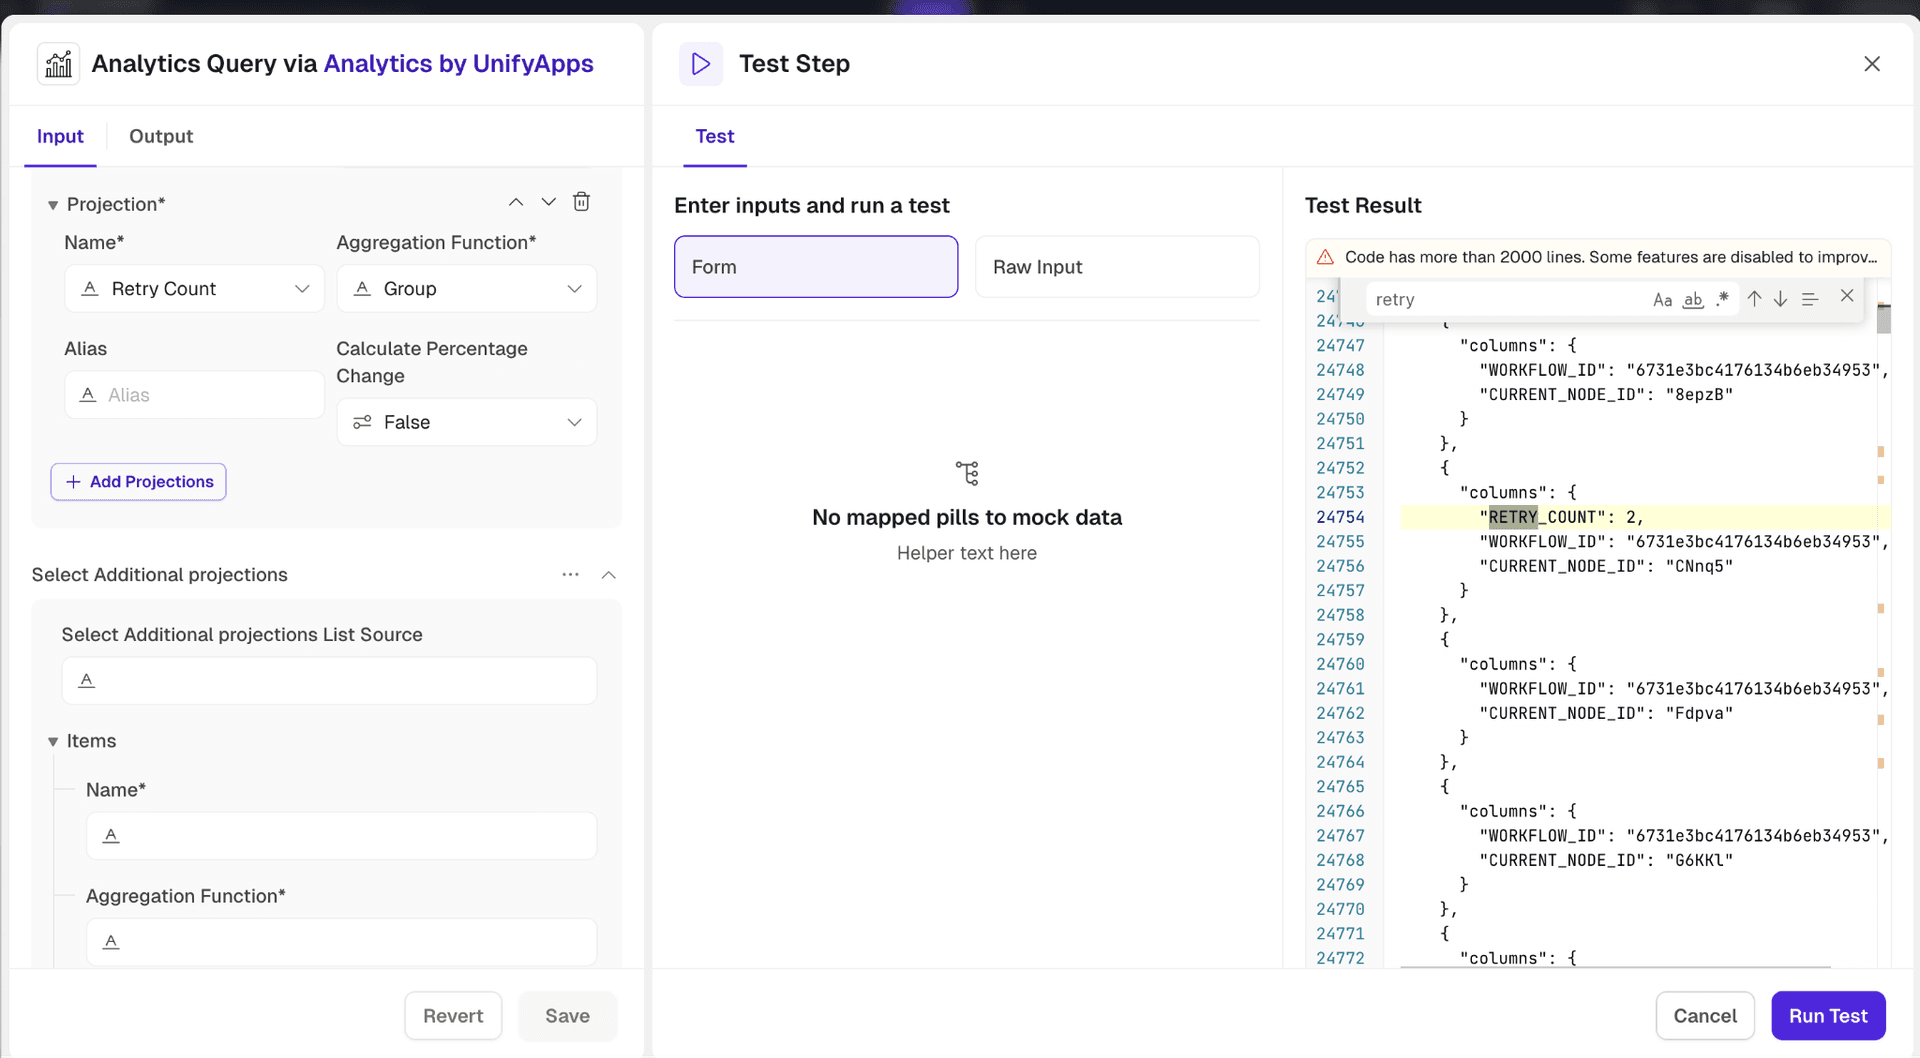
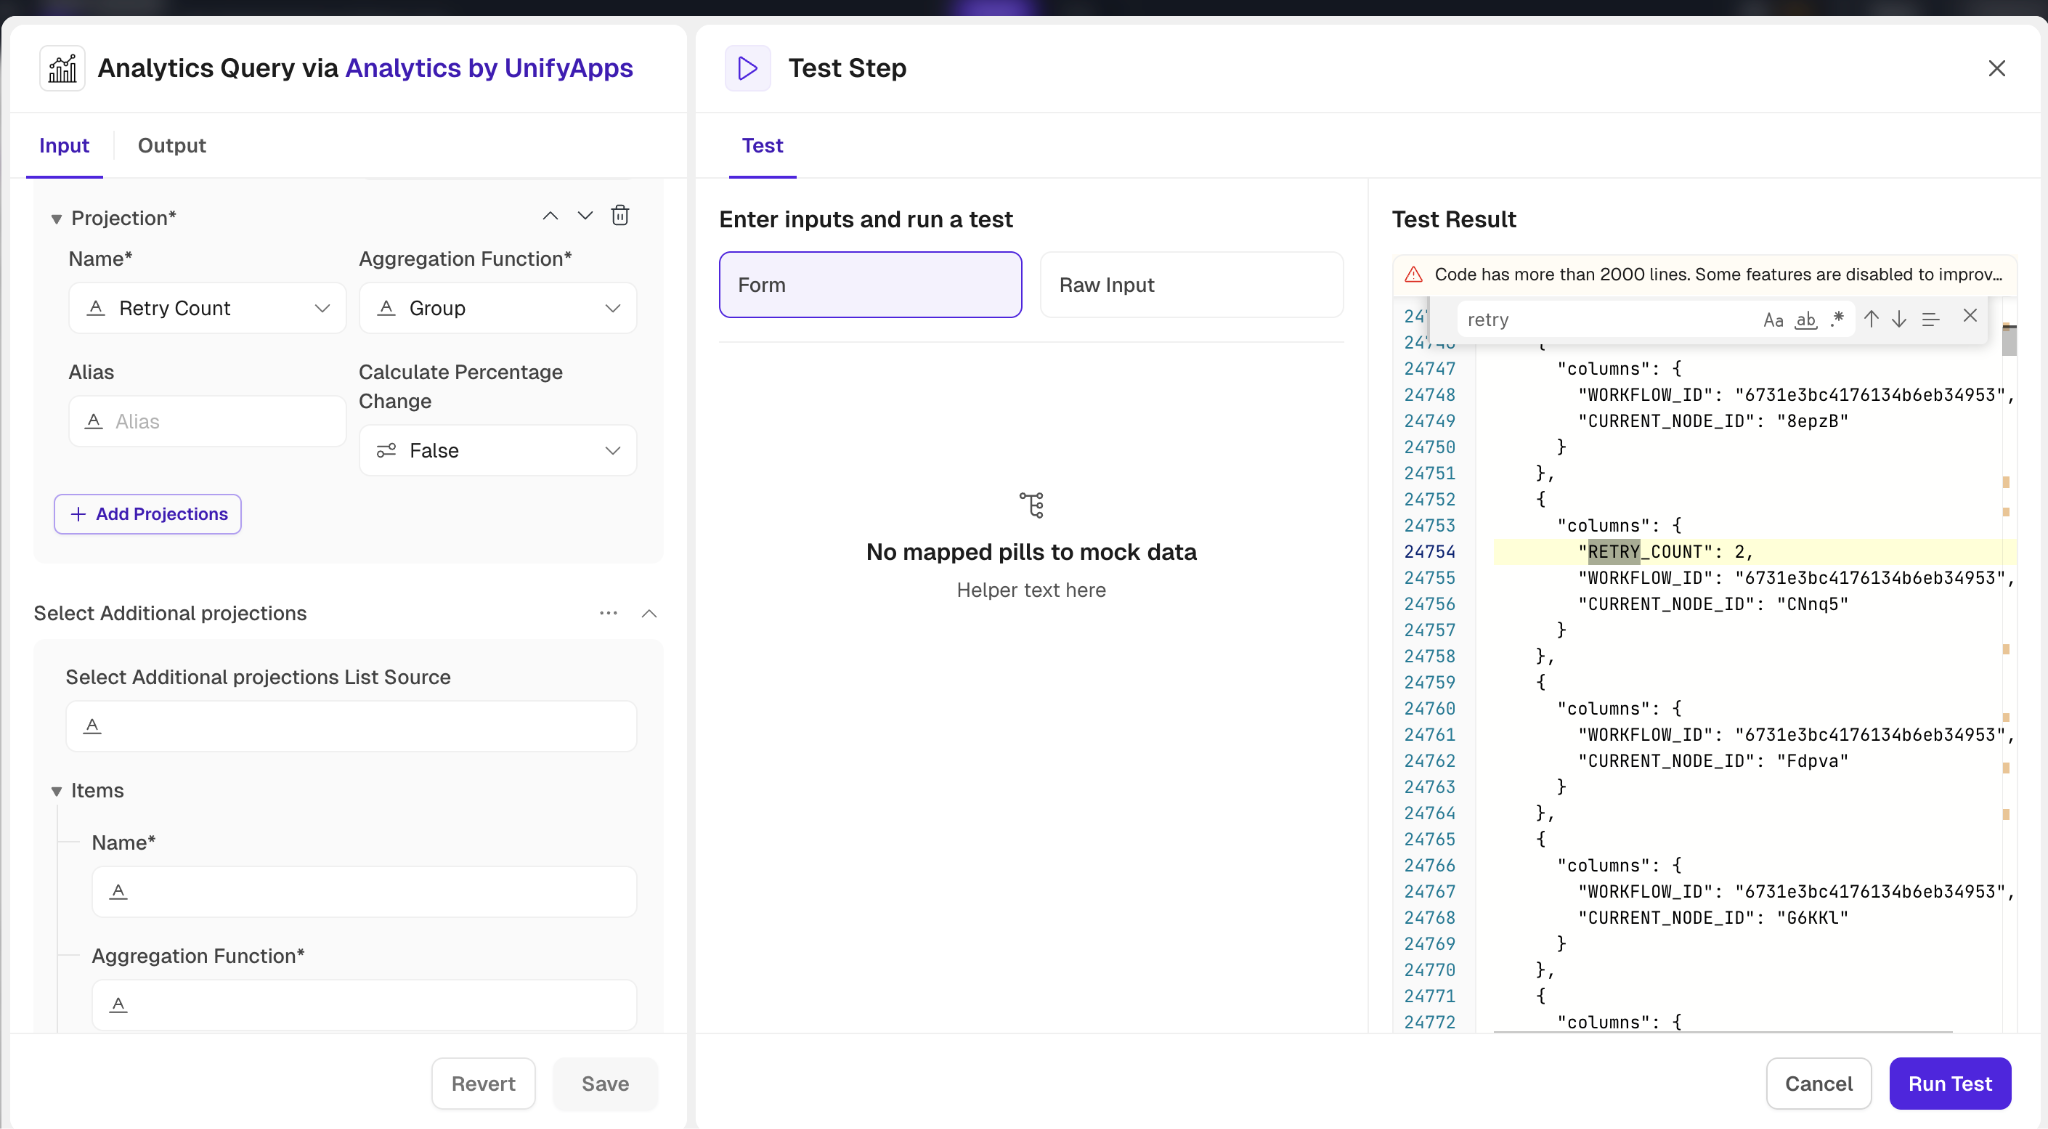
23. Retry Count : Number of times the node execution was retried due to failures or errors.
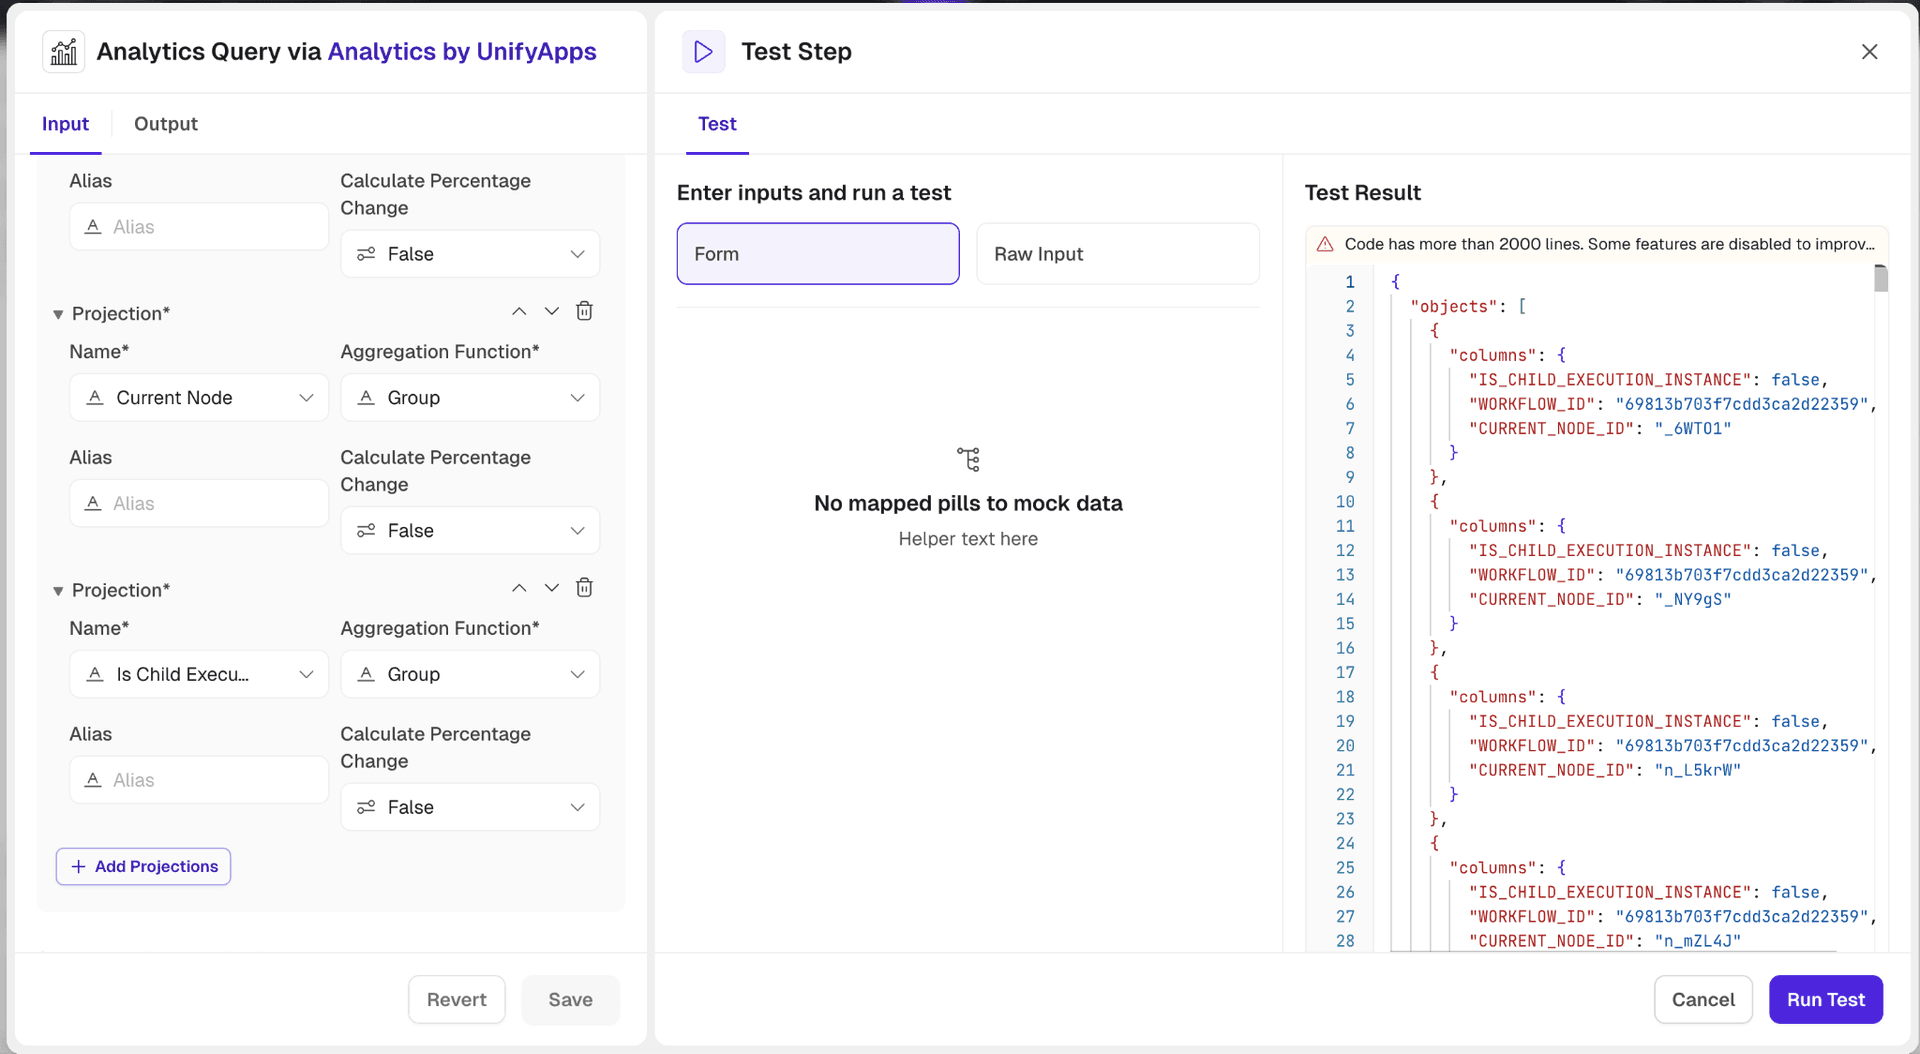
24. Is Child Execution Instance : Indicates whether the node execution instance is a child execution of another instance.
25. Successful Runs Count : Count of successful node executions, useful for performance and reliability analysis.

26. Failed Runs Count : Count of failed node executions, useful for identifying issues and improving workflow design.
27. Total Runs Count : Total count of node executions, useful for overall execution analysis and reporting.
28. Application Id : Identifier for the application associated with the node execution, if applicable.
29. Skipped : Indicates whether the node execution was skipped, which can occur due to conditional logic in the workflow.

30. Cache Hit : Indicates whether the node execution resulted in a cache hit, which can impact performance analysis.

31. Input : JSON representation of the input data for the node execution, used for debugging and analysis (PII).
32. Output : JSON representation of the output data from the node execution, used for debugging and analysis (PII).

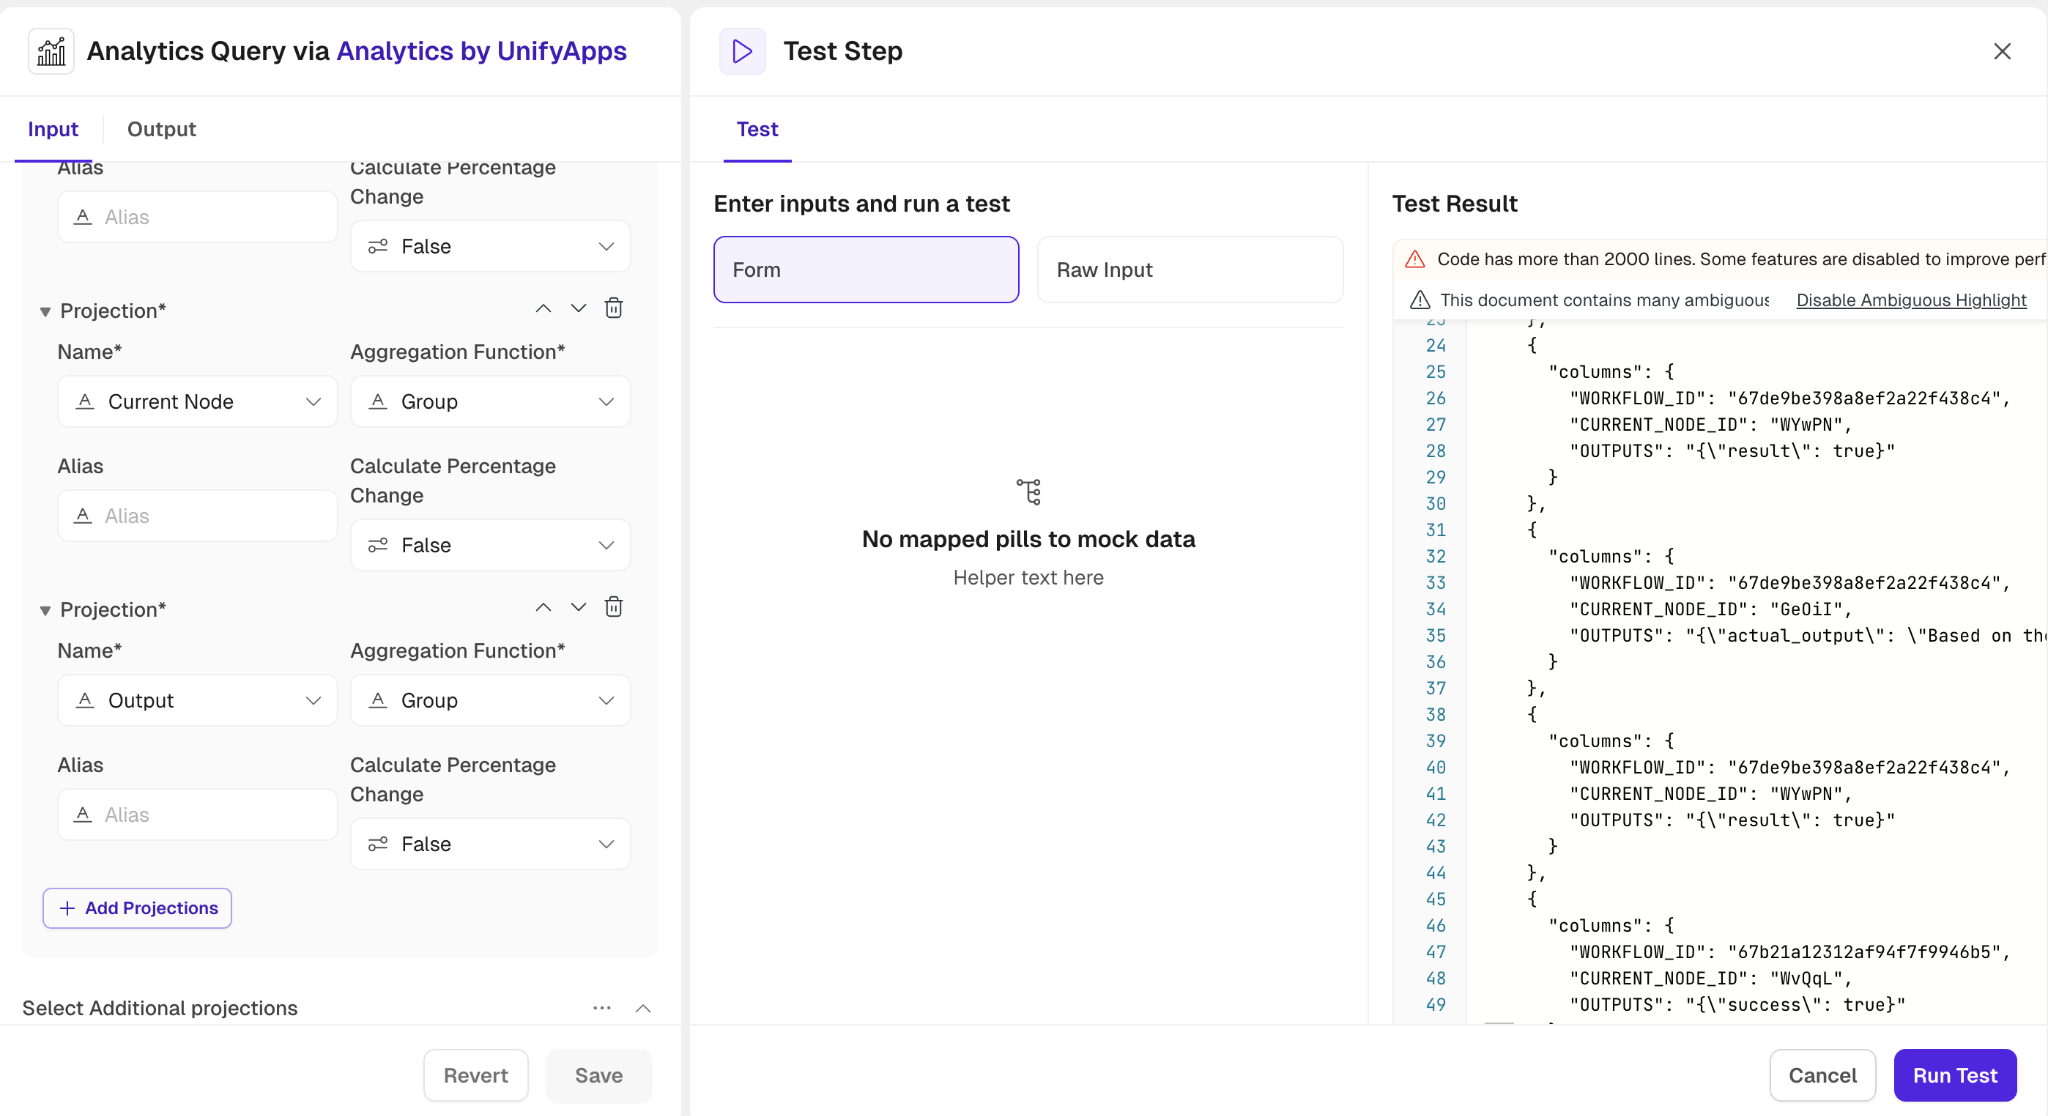
33. State : JSON representation of the state of the node execution, providing insights into execution context.
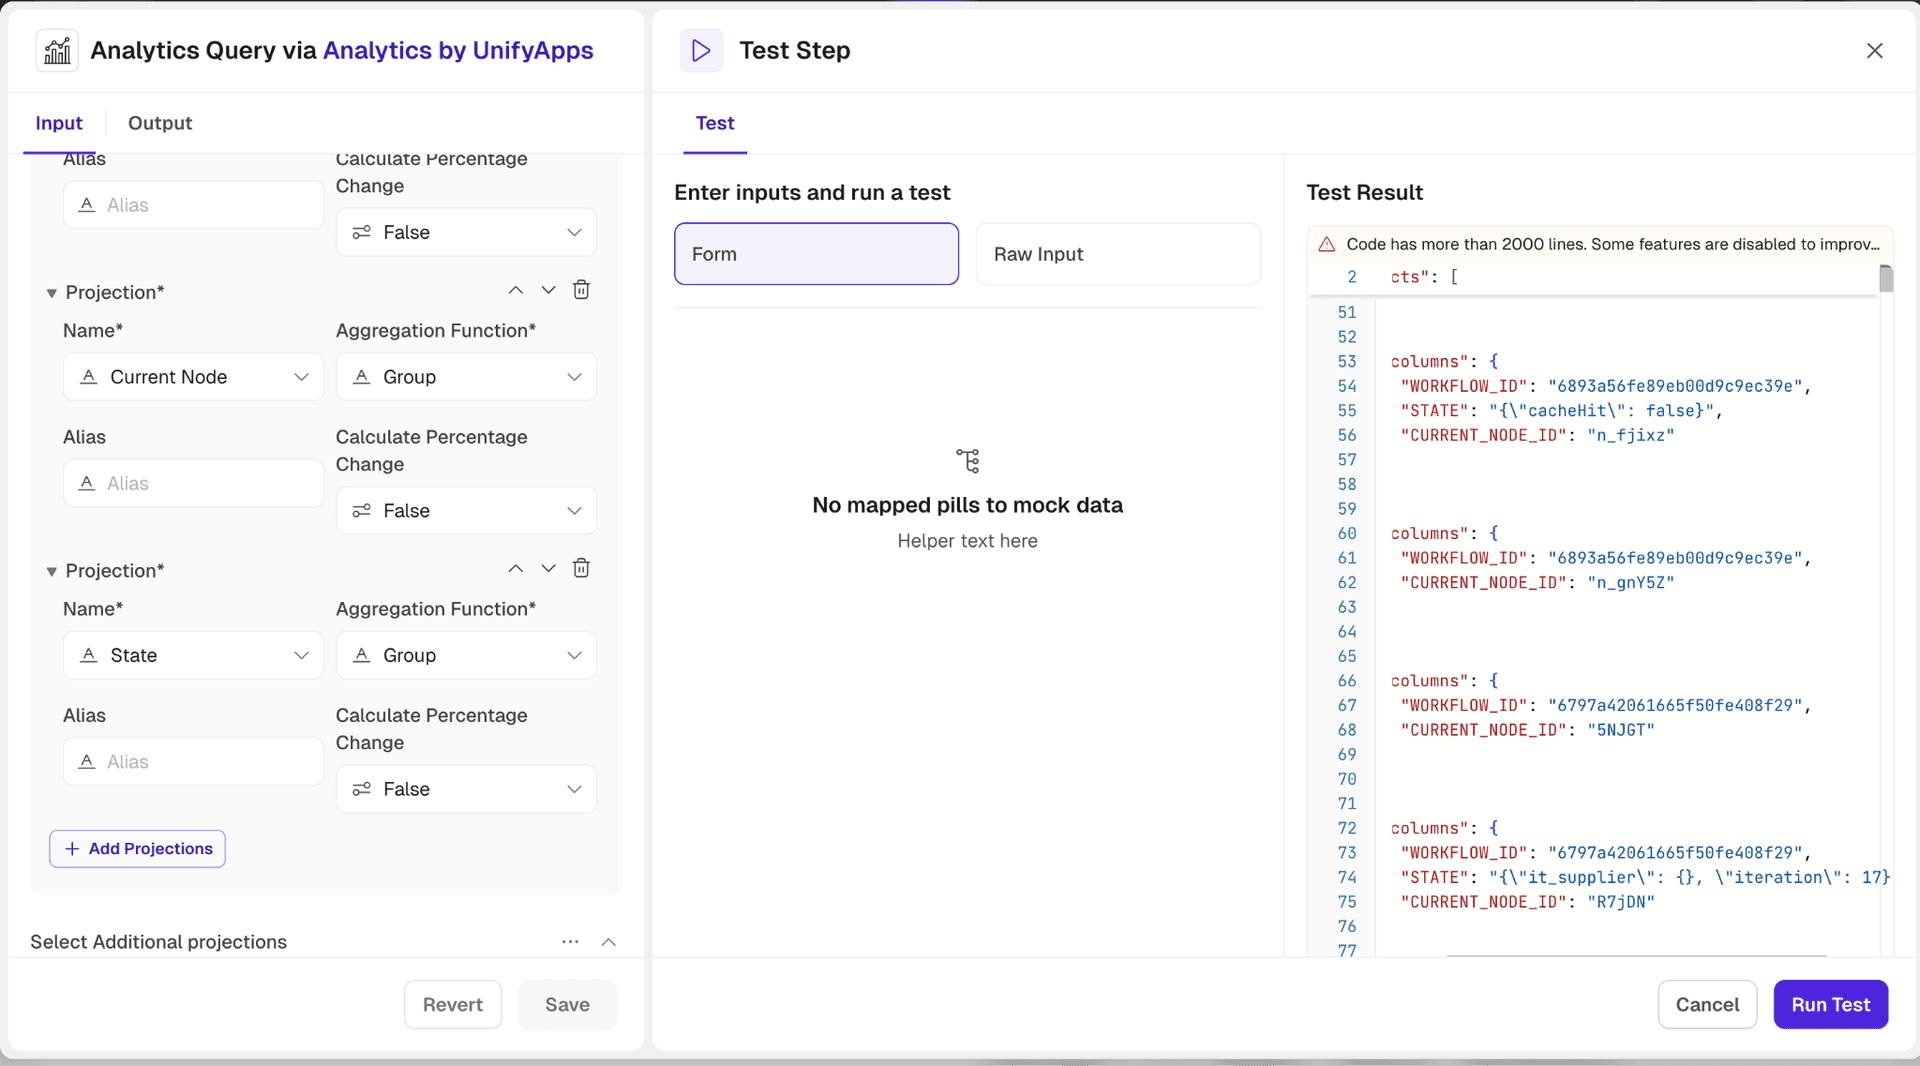
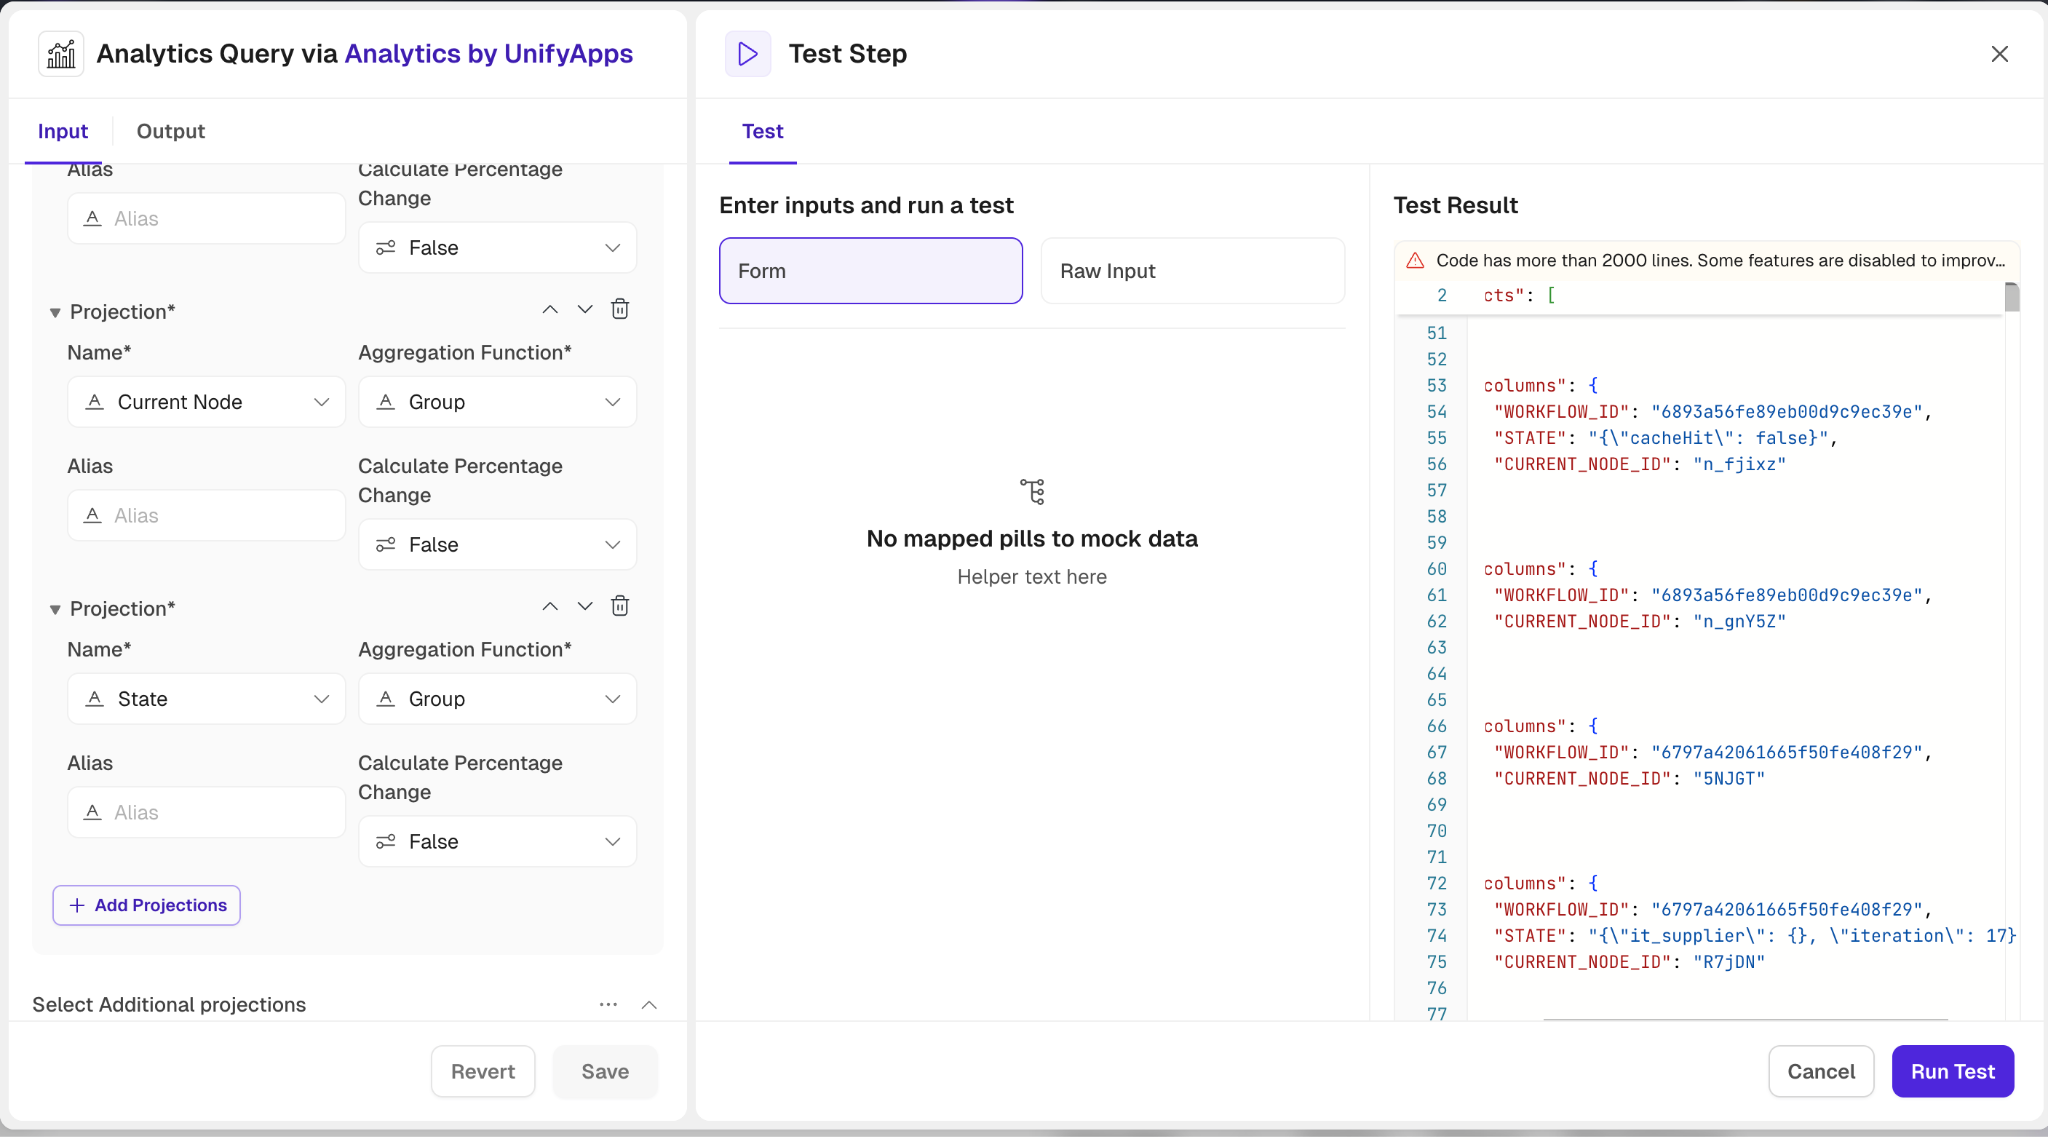
34. Node Execution Count : Total count of node executions for a specific node, useful for identifying frequently executed nodes.

35. Debugged : Indicates whether the node execution was debugged.
Execute Analytics SQL Query
.png&w=1080&q=75)
.png)
The Execute Analytics SQL Query action in Analytics by UnifyApps allows users to directly execute custom SQL queries against their data, providing granular control and flexibility for advanced analysis. This action supports dynamic schema definition and integration with custom workflows.
Input Fields Requirements:
SQL Query:Enter the SQL query to execute.
Prefix every table name with ENTITY_ and every column name with _pr_ to comply with the query format. Example: Select _pr_columnName from ENTITY_TableName
Select Group:Choose between Storage or Platform to define the data context.
Define Result Schema:Specify the structure of each row in the query response. This is essential for defining alias column names and ensuring accurate mapping.
Add Field: Manually add fields by specifying:
Key: Identifier for the field.
Display Label: Displayed label for the field.
Type: Data type (e.g., string, number).
Optional: Mark the field as optional.
Default Value: Set a fallback value.
Nest Under: Place the field within a hierarchical structure, if needed.
Use Code Snippet: Define the schema using a JSON, XML or XSD snippet.
Create a new snippet or select an existing one from saved options.
Map from Step: Map the schema directly from another automation step.
This action is ideal for advanced users who need to execute SQL queries for custom reporting, filtering, or complex data transformations while dynamically shaping the output schema.
Export Reports
.png&w=1080&q=75)
.png)
The Export Reports action provides users with the ability to generate and export customized reports based on specified parameters. This action enables users to select data projections, filters, sorting options, and define the desired time range, along with the option to include the total record count. Users can also choose between different file formats (CSV, XLS, or XLSX) for the exported report, ensuring flexibility and compatibility with various tools. The generated report is available for download via a preview link.
Input Fields:
.png&w=1080&q=75)
.png)
File Name: Prefix for the exported file name.Select Group: Choose between Storage or Platform for the data context.Select Base Report: Choose the base report object.Select Projections: Choose fields to aggregate and customize based on required operations like sum, count, etc.Time Range: Define the start and end time for the data included.Filter: Add conditions for filtering data.Search Object: Specify fields and their values to filter results..png&w=1080&q=75)
.png)
Page: Set offset and limit for paginated data.Sorts: Define how the data should be sorted.Include Total Count: Toggle to include the total count of records.File Format: Choose between CSV, XLS, or XLSX.
This action is ideal for users who need to export formatted reports, whether for internal analysis, sharing, or integration with other systems.
Converts Filter to SQL Condition
The Converts Filter to SQL Condition action in Analytics by UnifyApps enables users to transform visual filter inputs into a SQL-compatible condition string. This allows for seamless integration of UI-based filter logic into backend SQL queries, ensuring data consistency and query efficiency.
.png&w=1080&q=75)
.png)
Input Fields:
Group: Choose between Storage or Platform for the data context.Base Report:Choose the base report object. Filter: Set conditions to define what subset of data you want to filter. You can specify:Where: Enter the field name you want to apply the condition to.
Condition: Define condition operators such as Equals to, Start with, In etc.
Enter values for each condition.
Additional options include:
Add Condition: Add a new condition within the same group.
Add Condition Group: Create logical groups using AND/OR conditions.
Add Filter: Combine multiple filters for complex logic.
Output: The action returns a SQL-compatible condition string in JSON format.
.png&w=1080&q=75)
.png)
The output condition string can be directly appended to SQL queries, such as when using the Execute Analytics SQL Query action. This enables users to dynamically inject filter conditions into custom queries, enhancing automation, flexibility, and scalability of data-driven operations.
Export SQL Query Result
The Export SQL Query Result action in Analytics by UnifyApps allows users to execute a custom SQL query on a selected group (Storage or Platform) and export the result as a downloadable file. This is useful for automating data extraction, reporting, and sharing datasets across teams or systems.
Input Fields:
File Name: Provide a prefix for the exported file name. The full file name will include this prefix along with a timestamp and appropriate file extension.SQL Query: Write your SQL query to retrieve the desired data. You can query any available object or entity..png&w=1080&q=75)
.png)
Select Group: Choose between Storage or Platform for the data context.Define the Result Schema(Optional): Define the expected structure of each row in the query result. This helps in downstream automation where you may want to access specific fields. You can use:Add Field to manually specify field names
Use Code Snippet to write custom parsing logic
Map from Step to auto-map schema from previous step
Output: On successful execution, the action returns the following details:
File Type: The format of the exported file
File Name: The system-generated full filename
Source: Path within cloud storage
Source Type: Indicates storage type
Link: A secure URL to download the exported file
ua:type: Always returns "FILE" to indicate file object
Execute Analytics SQL Update Query
The Execute Analytics SQL Update Query action in Analytics by UnifyApps is used to modify existing records in a dataset using SQL UPDATE statements. This action is ideal for automation scenarios where dynamic updates to datasets are required based on business logic.
Input Fields:
.png&w=1080&q=75)
.png)
SQL Query: Provide a valid UPDATE SQL statement to modify data in the selected groupSelect Group: Choose between Storage or Platform for the data context.
Output:
.png&w=1080&q=75)
.png)
On successful execution, the action returns the count of records that were updated.