


Telemetry Metrics is the OpenTelemetry-based metrics layer for an automation: a workflow-level toggle plus a set of custom metrics you define — each one a Counter or a Timer, captured on a chosen execution outcome — that report run behavior into the Insights dashboards used to monitor automation performance.
Overview
Telemetry is about aggregate measurement across many runs, not the detailed record of any single run — that's what Logging captures. Turning on Telemetry Metrics for an automation feeds it counts, outcomes, and durations; leave Logging on separately for the per-run detail you'd need to debug one specific execution. The metric types on offer — a Counter and a Timer with histogram buckets — map to standard OpenTelemetry instrument types, so the metrics an automation emits follow the same shape teams already use for service-level observability.
Where: Workflow settings › Settings tab › Telemetry Metrics
Enabling Telemetry Metrics
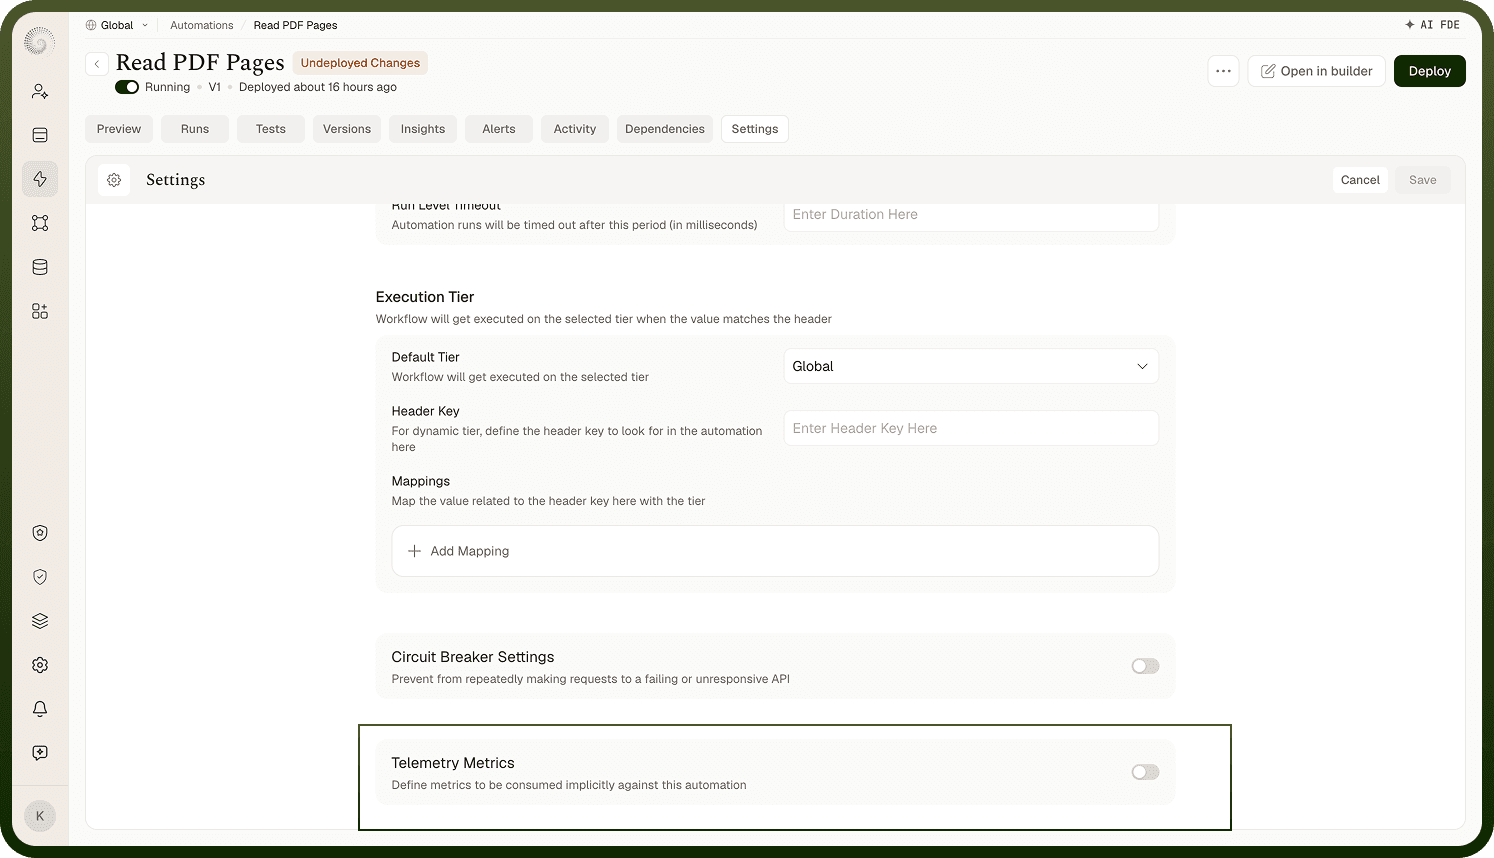
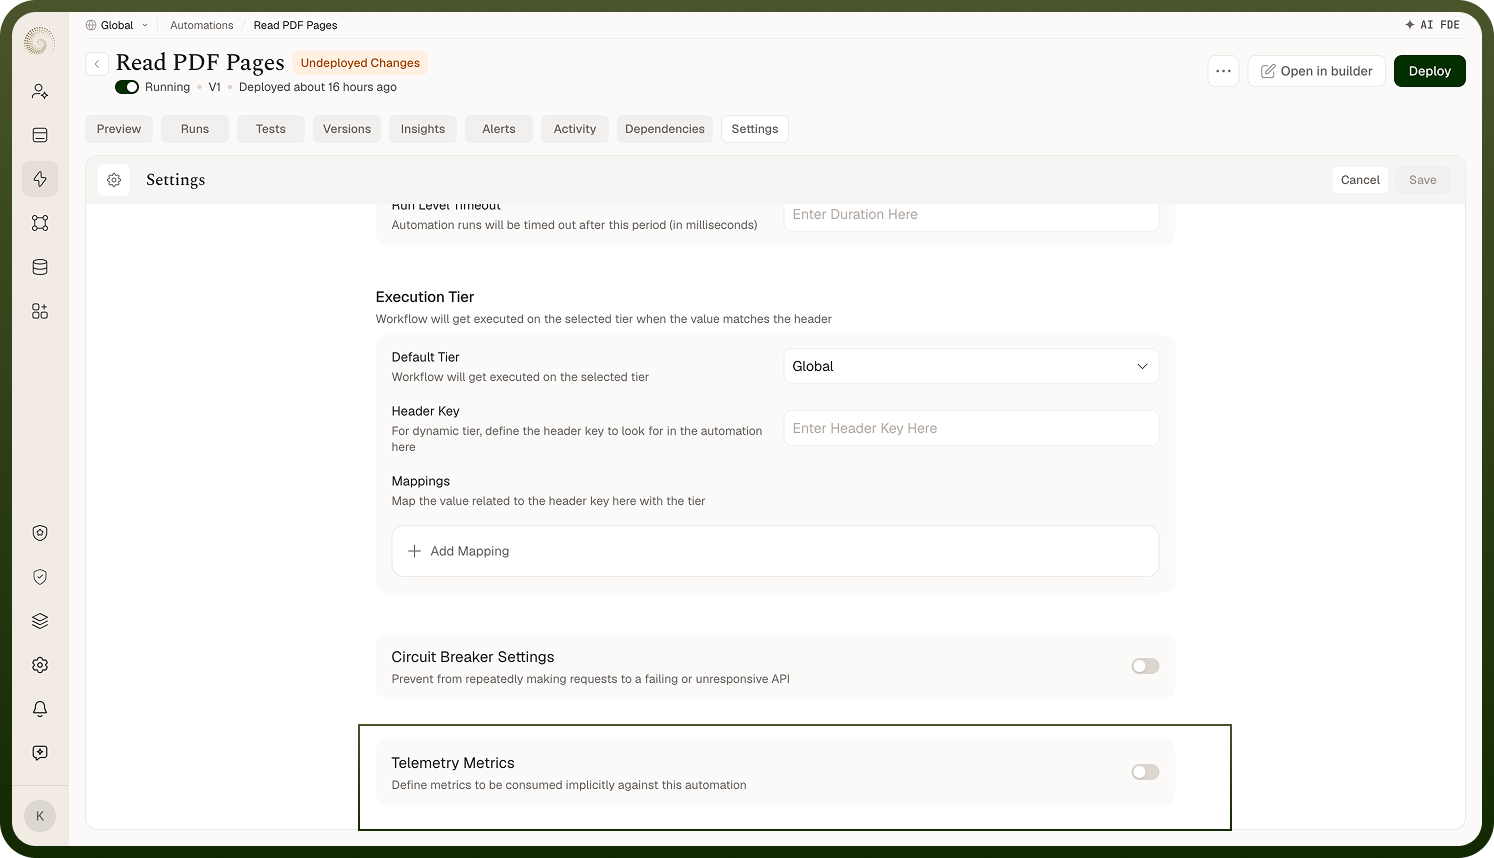
Telemetry Metrics lives on the automation's Settings tab, below Execution Tier and Circuit Breaker Settings. Turning it on reveals an "Add New Metric" control where you define the metrics this automation should emit.
Telemetry Metrics toggle enabled on an automation's Settings tab, showing the Add New Metric control
Telemetry Metrics section on the Settings tab, toggled on.
Open the automation and go to its Settings tab.
Scroll to Telemetry Metrics and turn on the toggle.
Click "+ Add New Metric" to define a metric (see below).
Click Save on the Settings tab to persist the change — closing the metric dialog alone does not save it.
Defining a Metric
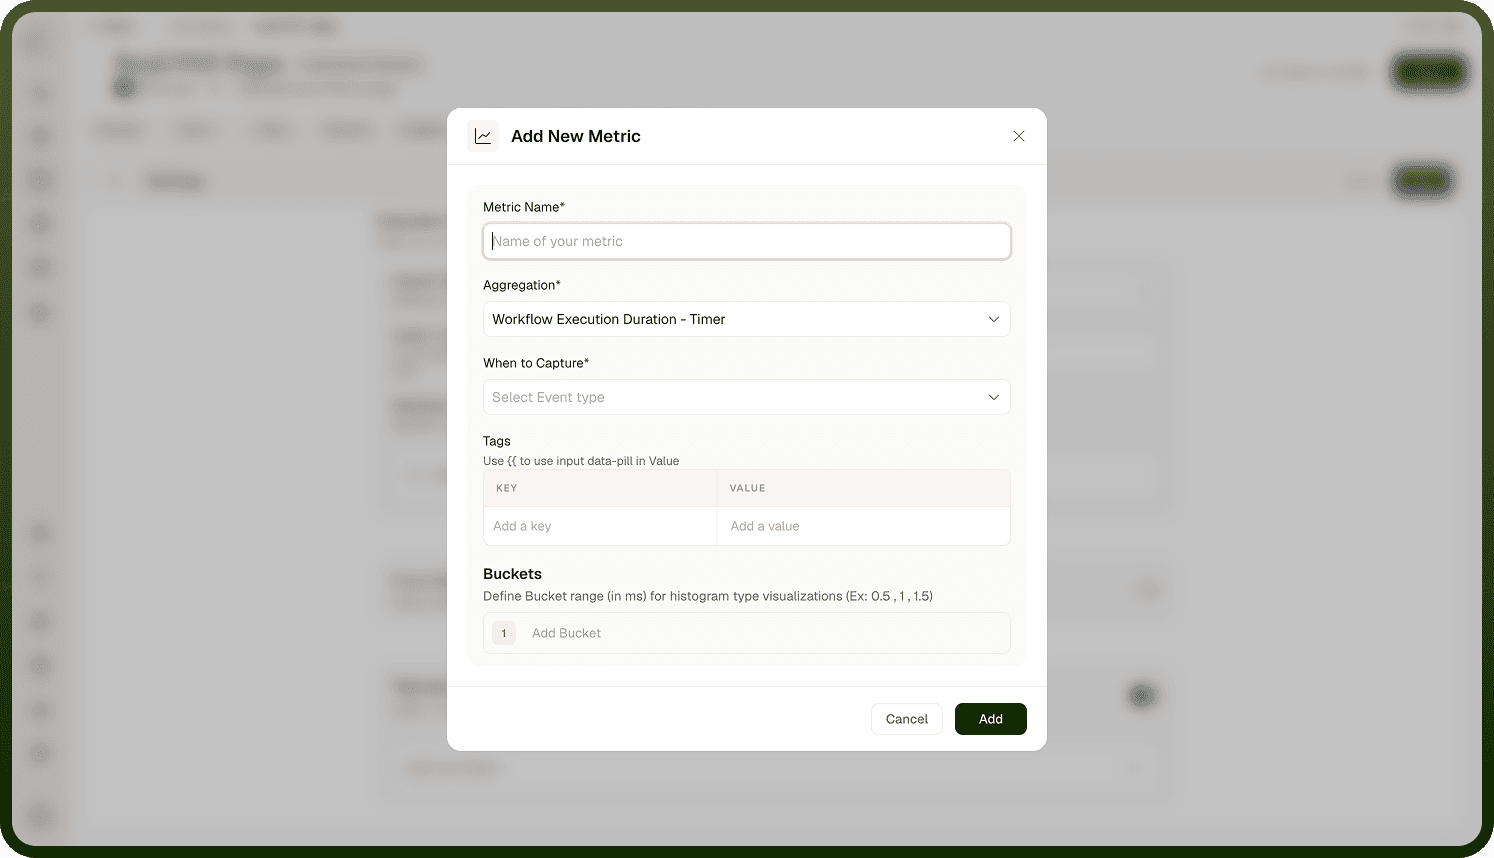
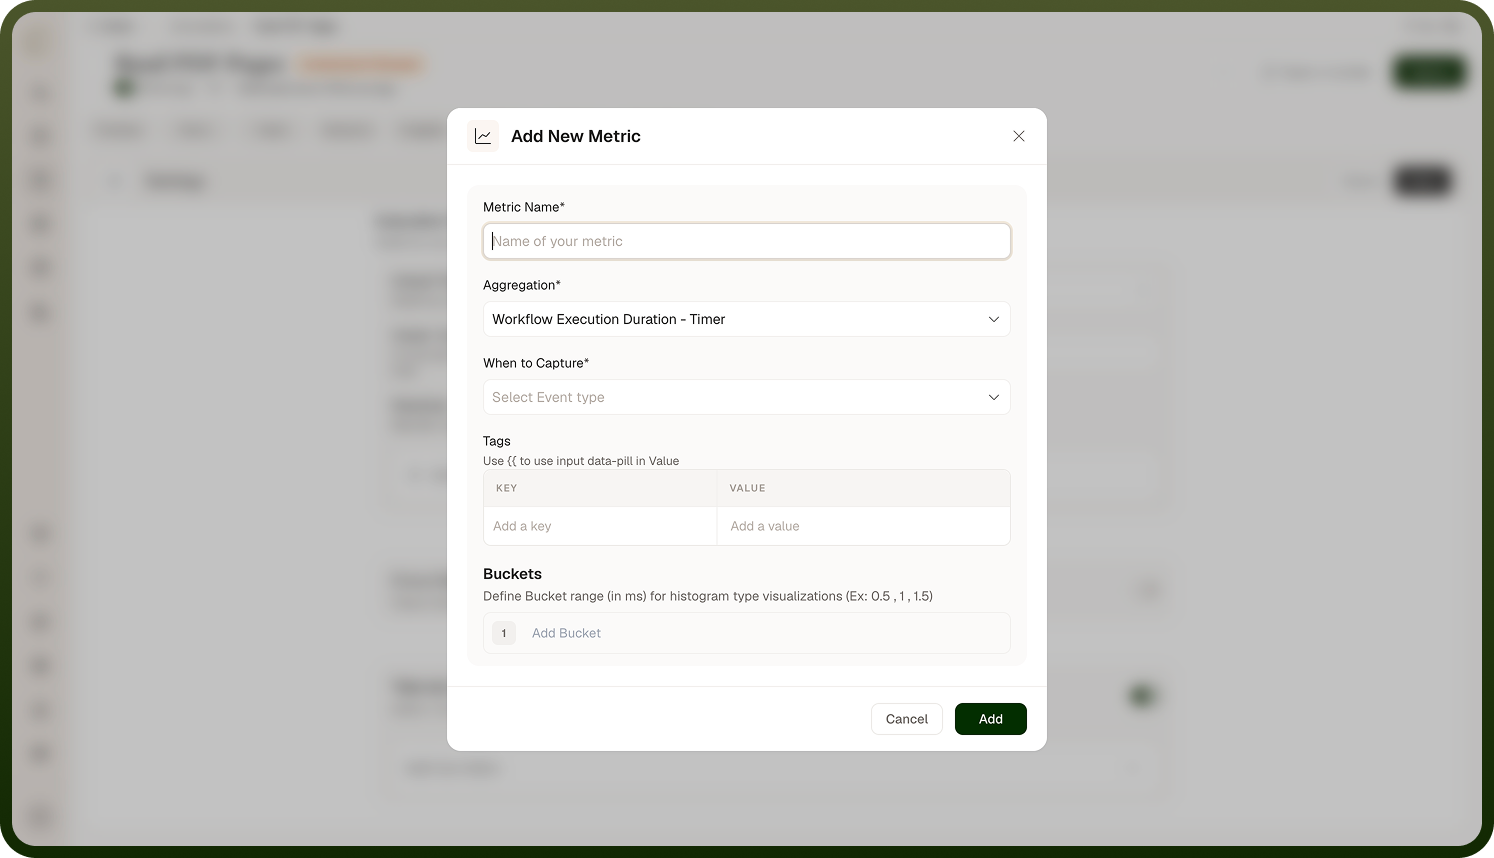
Each metric is configured independently through the "Add New Metric" dialog:
Add New Metric dialog showing Metric Name, Aggregation, When to Capture, Tags, and Buckets fields
The Add New Metric dialog, reached from Telemetry Metrics.
Field | Description |
|---|---|
Metric Name* | The name this metric is stored and reported under. |
Aggregation* | The metric's instrument type: Workflow Execution - Counter increments a count each time the chosen event fires; Workflow Execution Duration - Timer records how long the run took, rendered as a histogram. |
When to Capture* | The execution outcome that triggers the metric: Always on Finished Execution, Only on Successful Execution, or Only on Failed Execution. |
Tags | Optional key-value pairs attached to the metric for filtering and grouping in Insights. The Value field accepts a data pill from an earlier step (type {{ to insert one). |
Buckets | Bucket boundaries in milliseconds for histogram-type visualizations (e.g. 0.5, 1, 1.5) — only relevant when Aggregation is set to Timer. |
Note: Metric Name, Aggregation, and When to Capture are required for every metric; Tags and Buckets are optional and refine how the metric is grouped or visualized.
Scope
Telemetry can be turned on in two places:
Per automation — enable Telemetry Metrics from that automation's own Settings tab, as described above.
Workspace-level — a separate telemetry setting applies across automations. Current source material doesn't specify how the workspace-level and per-automation settings interact when they disagree; flagged for verification before publishing.
Notes
Telemetry Metrics feeds aggregate metrics (counts, outcomes, durations) to Insights — it does not add detail to individual run records.
Use Logging, not Telemetry Metrics, when you need to inspect what happened inside one specific run.
Pick Counter for "how often" questions and Timer for "how long" questions; only Timer metrics use Buckets.
A workspace-level telemetry setting exists in addition to the per-automation toggle described here.
Changes on the Settings tab aren't applied until you click Save.