


The Workflow Debugger lets you pause an automation run at specific nodes — called breakpoints — so you can inspect inputs, outputs, and execution state before allowing the run to continue.
Overview
The Workflow Debugger lets you pause an automation run at specific nodes — called breakpoints — so you can inspect inputs, outputs, and execution state before allowing the run to continue.
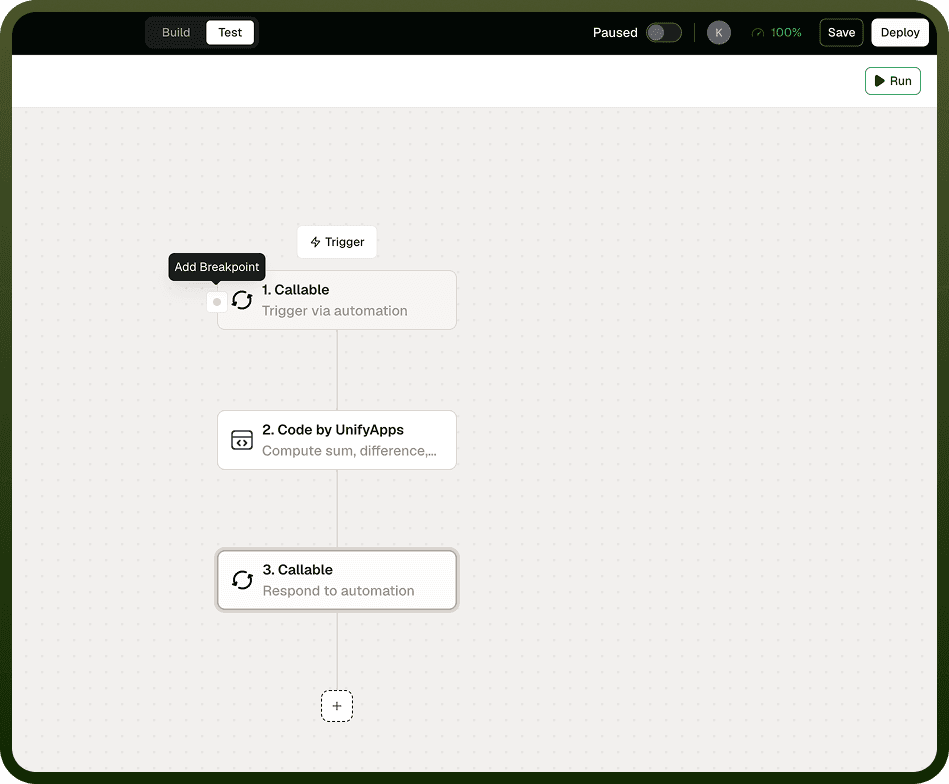
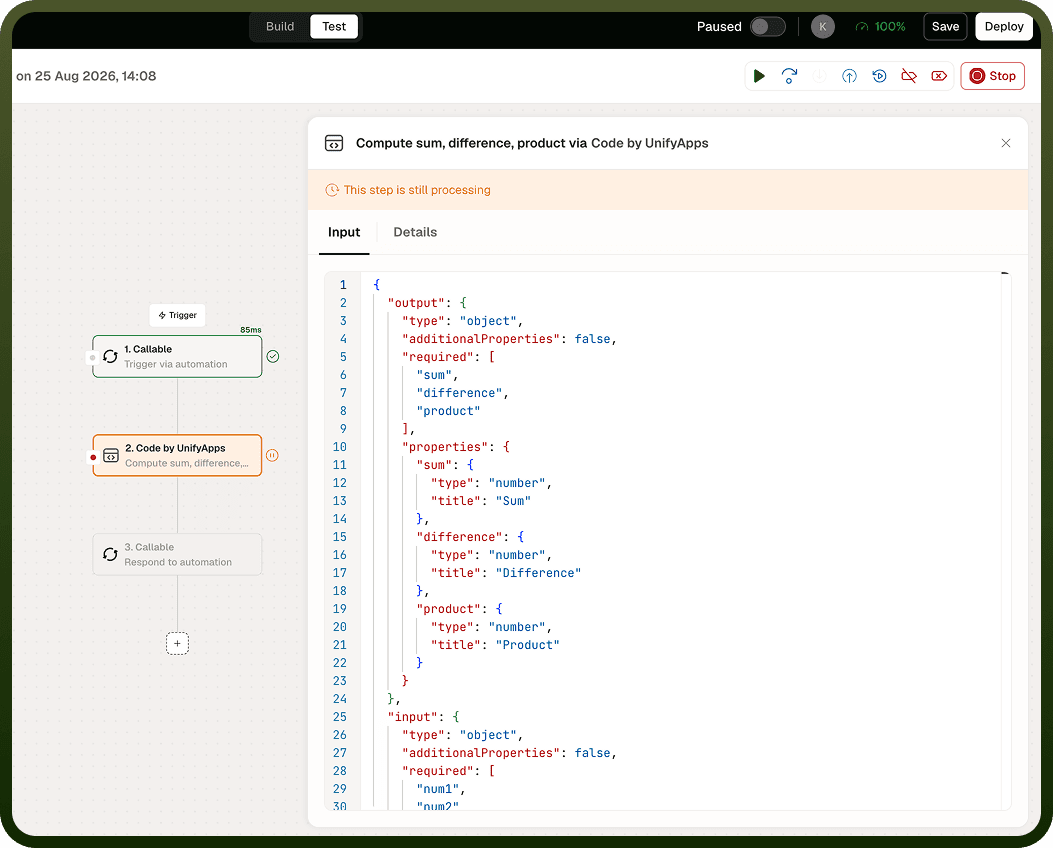
Breakpoints are intentional pause points you set on any node in the automation. When a run reaches a breakpointed node, the execution halts and you can examine exactly what data the node received and what it returned before deciding how to proceed. This makes it possible to find the source of a bug without guessing which node produced the wrong output.
Actions in Breakpoints
When the debugger is paused at a breakpoint, four controls are available:
Action | What it does |
|---|---|
Continue | Resumes execution and runs all nodes until the next breakpoint (or the end of the automation) |
Step over | Executes only the current node, then pauses at the next node — lets you advance one step at a time |
Step into | For Callable automation nodes: runs the child automation first and pauses there, then returns to the parent when the child completes. Use to debug a called sub-automation in context |
Stop | Cancels the run entirely; remaining nodes enter a disabled state and the run is marked as cancelled |
Features
Set a breakpoint on any node by clicking the breakpoint marker in the node toolbar.
Multiple breakpoints can be active simultaneously; "Continue" jumps to the next one.
The input and output panels update at each pause so you can compare expected and actual values.
"Step over" skips into sub-automations — "Step into" enters them, letting you trace execution across callable boundaries.
The debugger works in both the Test environment and on deployed automations (for in-progress runs).
Cancelling a paused run with "Stop" does not roll back any external actions already completed (API calls, record creates, and so on).
Loop iterations can be advanced one at a time with "Step over", making it possible to trace a loop without running all iterations.
Use Cases
Finding bugs — Set a breakpoint just before a suspicious node. When the run pauses, inspect the input to confirm what the node received; compare it to what you expected.
Understanding code behavior — Use "Step over" to walk through an automation one node at a time and build a mental model of the execution path.
Debugging loops — Set a breakpoint inside a For Loop and use "Step over" to advance iteration by iteration, watching variables and counters change.
Verifying callable automation calls — Use "Step into" to follow execution into a called sub-automation and confirm it receives the right inputs.
Notes
The Workflow Debugger is the fastest way to diagnose automation logic issues without adding temporary logging nodes. To use it effectively:
Place breakpoints at decision points (before a Branch or Condition node) to confirm the routing logic sees the right data.
Use "Step into" for callable automations only when you need to trace inside the child — otherwise "Step over" is faster and keeps focus on the parent.
Remember that "Stop" does not undo external actions already executed; always test in a sandbox environment before debugging an automation that modifies production data.
Remove all breakpoints before treating a run as a valid production run — a run paused at a breakpoint will hang indefinitely until acted on.