


This guide walks you through diagnosing and fixing common automation issues — failed runs, unexpected node output, missed triggers, and slow execution — using the Run History screen as your primary tool.
Overview
This guide helps you diagnose and resolve issues with individual automations — including failed runs, nodes that return unexpected data, automations that do not trigger as expected, and runs that take longer than they should. Use it alongside the Run History screen, where execution details are recorded step by step.
Most issues surface directly in the run details view. Start there before looking elsewhere: the run canvas shows exactly what each step received, what it returned, and how long it took.
Note: Run History only captures data when run logging is enabled. If you open Run History and see Run logging is not enabled, click Enable Logging before your next run so that step-level details are saved.
Diagnosing a Failed Run
When an automation run fails or finishes with errors, follow these steps to identify the root cause.
Step 1 — Find the run in Run History
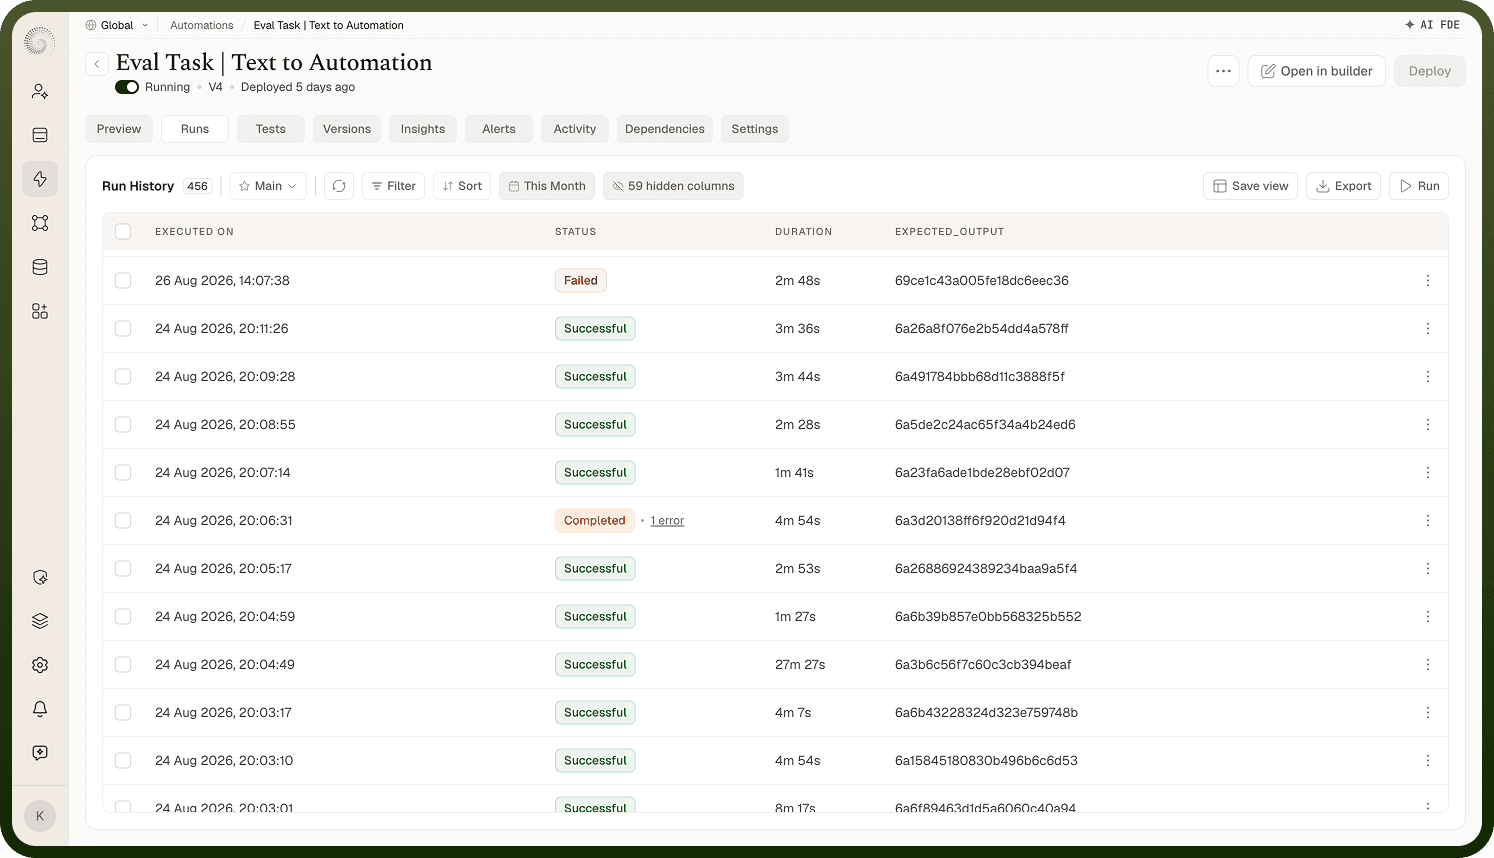
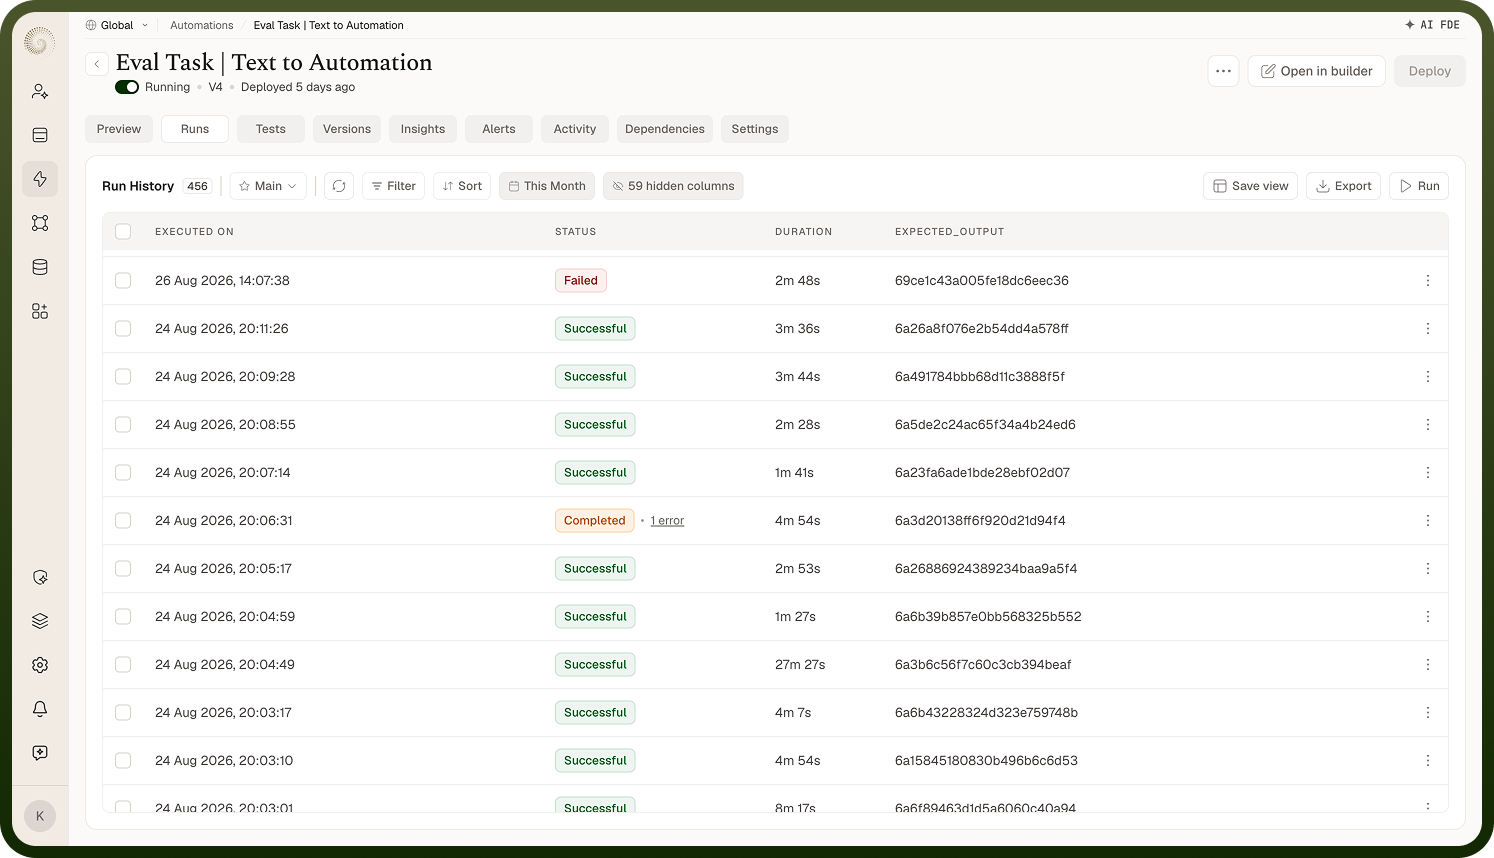
Open the Run History screen for the automation. Runs are listed newest first, with a Status column showing colored pills. Look for:
Failed — the run stopped before completing.
Completed — the run finished but one or more steps returned errors (shown in amber). A N errors link appears next to the status pill.
Use the date-range filter at the top of Run History if the run you want is not in today's view. The list loads 30 runs at a time; scroll to reveal older entries.
Step 2 — Jump to the failing step
For a Completed run, click the N errors link next to the status pill. A Steps with errors popover opens listing every step that failed. Click a step name to jump directly to it inside the run details canvas.
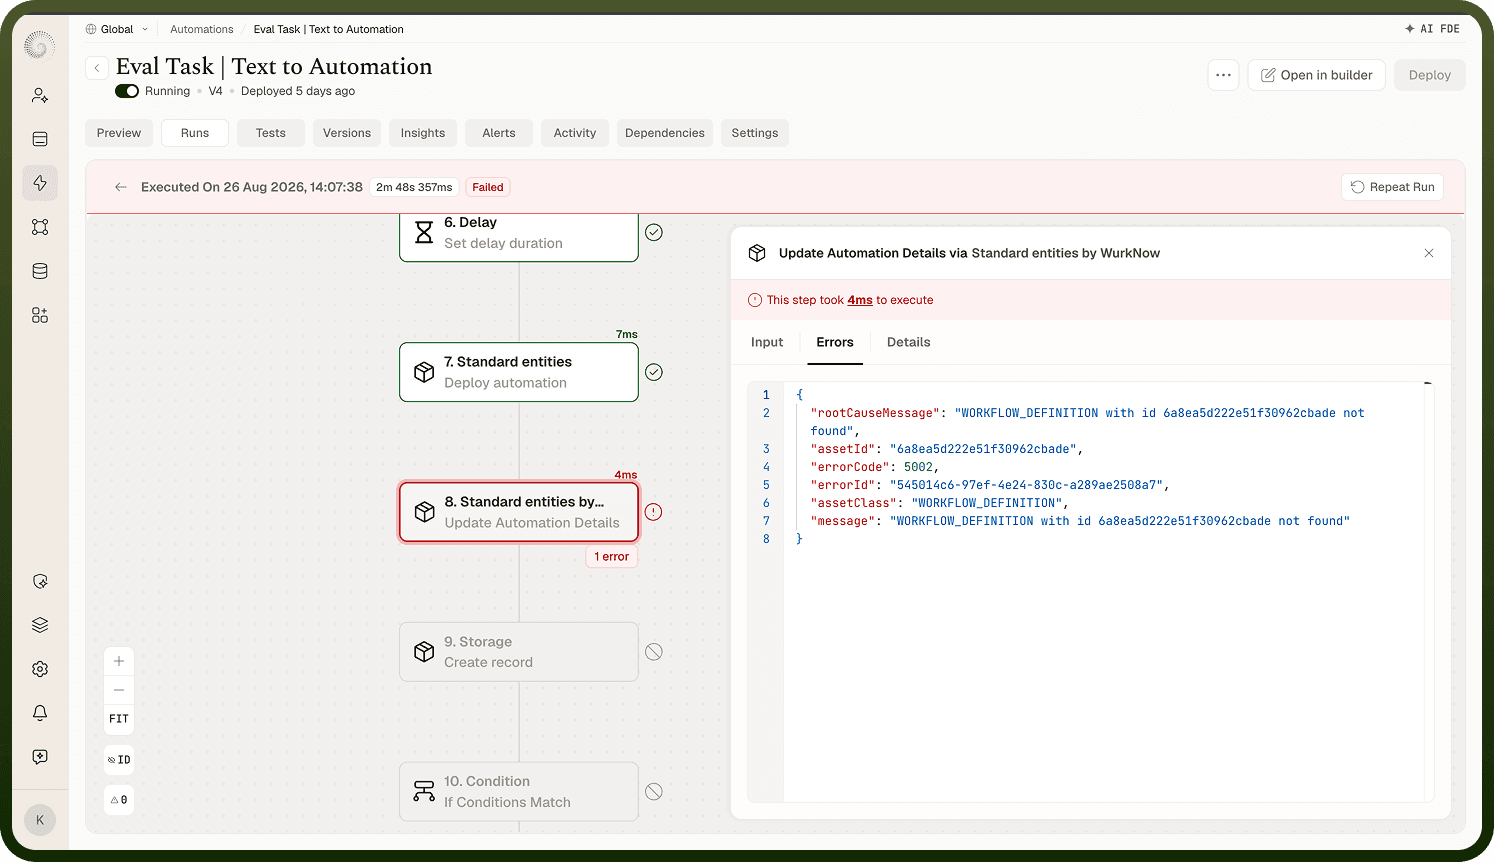
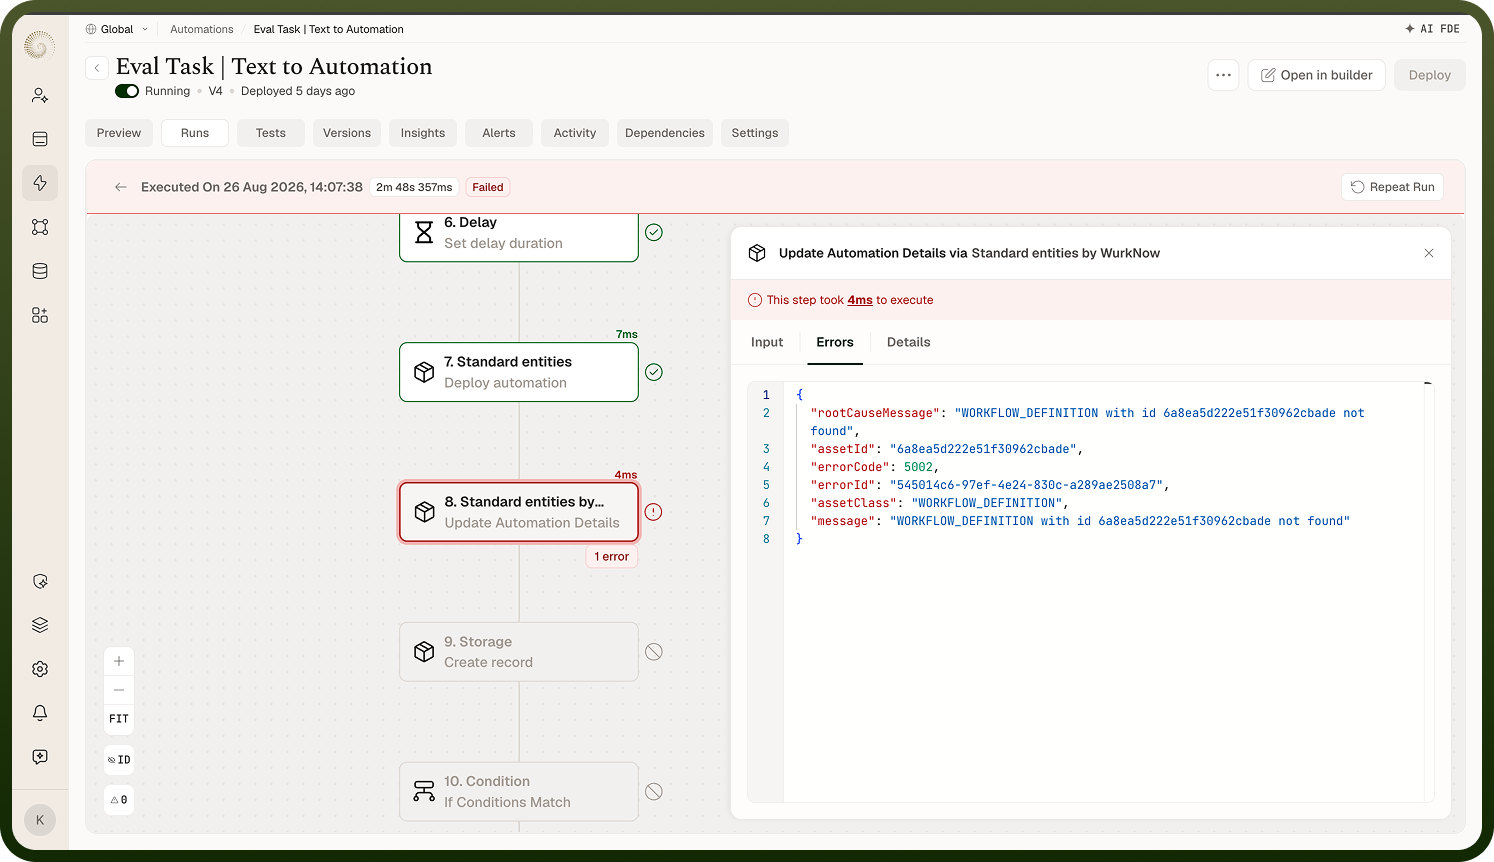
For a Failed run, open the run (use the row's open-in-new-tab icon or click to preview it). The run canvas replays the execution as a read-only flow. Click any step to see what it received and what it returned.
Step 3 — Read the step's error details
Inside the run, select the failing step. The properties panel shows:
The error message the step returned.
The exact inputs the step had at the time of failure.
Timing: This step took {time} to execute with start and end timestamps, or This step is still processing if the run is ongoing.
Retry attempts, labeled Retry #1, Retry #2, and so on, if the step was configured to retry.
Walk the steps in order, from the trigger downward, to trace where good data came in and where it broke. Steps marked This step was not executed were skipped because an earlier step failed.
Step 4 — Check logging depth if details are missing
If you can open a run but cannot see a step's inputs or outputs, logging may not be capturing enough detail:
Step Details not enabled — enable Step Details in the automation's settings.
Full Trace is turned off — enable Full Trace in the automation's settings to capture inputs and outputs on future runs.
Note: Changes to logging depth only take effect for runs that start after the setting is saved. Past runs that were recorded at a lower detail level cannot be upgraded retroactively.
Step 5 — Fix and re-run
After identifying the problem, fix the configuration in the flow builder. Then use Repeat Run from the run's details view to re-execute without having to supply new trigger data manually. You have two options:
Run Complete Workflow — re-runs the entire automation from the trigger using the original trigger data.
Run from Failed Step — resumes the run from the step that failed, skipping steps that already succeeded.
Use Review Trigger Data before confirming to check or adjust the original payload. Confirm with Trigger Run. A success message reads Automation triggered successfully.
Note: If the failed step cannot be resumed, the option reads This error cannot be retried. In that case, use Run Complete Workflow instead.
Common Issues and Solutions
Issue | Likely Cause | Fix |
|---|---|---|
Run history is empty | Run logging is disabled, or the automation has never been deployed and executed. | Open Run History and click Enable Logging. If logging is on and the list shows No runs found, deploy the automation and trigger it at least once. |
Run history shows runs but step inputs and outputs are missing | Logging depth is set too low — Step Details or Full Trace is not enabled. | Go to the automation's settings and enable Step Details and Full Trace. Re-run the automation to capture full detail. |
A step returns unexpected or wrong data | Input fields are mapped from the wrong step output, or a data pill references a field that does not exist at runtime. | Open the run details for a recent execution and click the failing step to inspect its inputs. Then open the step in the flow builder, go to the Input tab, and verify the data pills map to the correct fields from the correct upstream steps. Use Test on the step to confirm its output before saving. |
Automation does not trigger | The automation is paused, not deployed, or the trigger condition is not being met by incoming events. | Check the flow builder header — the Running / Paused switch must be set to Running. Confirm the automation has been deployed (the Deploy button is inactive when no unpublished changes exist). Review the trigger's App & event and Setup tabs to verify the event type and any filter conditions match what you expect. |
Run button in Run History is greyed out | The automation has not been deployed yet. | Save and deploy the automation from the flow builder. The Run button tooltip reads Deploy the automation to execute it until the first deployment is complete. |
A step's connection shows as invalid or missing | The connection was deleted, credentials expired, or the step was pasted from another automation without its connection. | Open the step in the flow builder and go to the Connection tab. Select a valid active connection from the list, or click Add new connection to set one up without leaving the step. See Connection Troubleshooting for credential-specific guidance. |
Skipped step runs unexpectedly | The step was previously skipped for testing and not unskipped before deployment. | Right-click the step on the canvas and select Unskip. Save and redeploy the automation. |
Step retries are not happening | Retry is not configured for that step. | Open the step's Input tab in the flow builder and expand the advanced settings strip at the bottom. Enable and configure Retry for the step. Note that retry settings are per-step and do not inherit from automation-wide settings. |
Error handling stops the automation unexpectedly | The step's error handling is set to Stop automation, which is the default behavior when a step errors. | Open the step's Input tab, expand the advanced settings strip, and change Error handling to Follow error path or Continue automation as appropriate for your flow. |
Automation passes wrong data into a loop | The loop step is iterating over the wrong list, or the input data pill points to a scalar value rather than an array. | Open the run details and click the loop step to see the Iteration N of N count and the data it iterated over. Then open the loop step in the flow builder and verify the input field is mapped to a list-type output from an upstream step. Use View all iterations inside a run to inspect each pass. |
Performance Issues
If an automation is taking longer than expected, use run details to identify which steps are the slowest before making changes.
Identifying slow steps
Open a completed run in Run History and click through each step. The properties panel shows This step took {time} to execute with exact start and end timestamps. Steps that are slow relative to the others are good candidates for investigation. A step labeled This step was cached & took {time} to execute ran from cache rather than calling the external service, which is the fastest possible outcome for a repeated call.
Using caching to reduce repeated calls
For steps that call external services and return data that does not change frequently, enable Caching on the step. Open the step's Input tab in the flow builder, expand the advanced settings strip, and turn on Caching. When a cached result is reused, the run details label the step accordingly.
Checking retry behavior
If a step is configured to retry on failure, each retry adds to the total run duration. In a run's details, retried steps are labeled Retry #1, Retry #2, and so on. If retries are frequent, investigate whether the underlying service is reliably available or whether the step's inputs are causing the failures in the first place.
Reviewing automation-wide settings
Per-step settings (caching, retry, error handling) apply to individual steps. Run-wide behavior — including timeout and circuit-breaker configuration — is managed in the automation's settings screen, separate from the flow builder's properties panel. Adjust run-wide timeout values there if individual steps consistently run close to the limit.
Note: Sub-automation steps link through to the child run's details. If a step that calls a sub-automation is slow, open the child run to inspect its steps individually.
Notes
To make the most of Automation Troubleshooting:
Enable run logging — including Step Details and Full Trace — before running automations in production so that complete diagnostic information is available from the first run.
Use the Test button on individual steps in the flow builder to validate a step's output before wiring it to downstream steps.
Use the Skip feature to isolate and temporarily bypass steps during debugging, then Unskip before deploying.
Use Run from Failed Step after fixing a configuration error to avoid re-running steps that already succeeded and avoid side effects from re-triggering upstream actions.
Check the error count badge and score in the flow builder header after making changes — these reflect validation issues before a run even starts.
For connection-related step failures, refer to the Connection Troubleshooting guide for credential and network-level diagnosis steps.
If issues persist after following these steps, contact support@unifyapps.com with the run ID and the name of the failing step.