

Analytics by UnifyApps enables comprehensive data analysis and reporting capabilities.
Overview
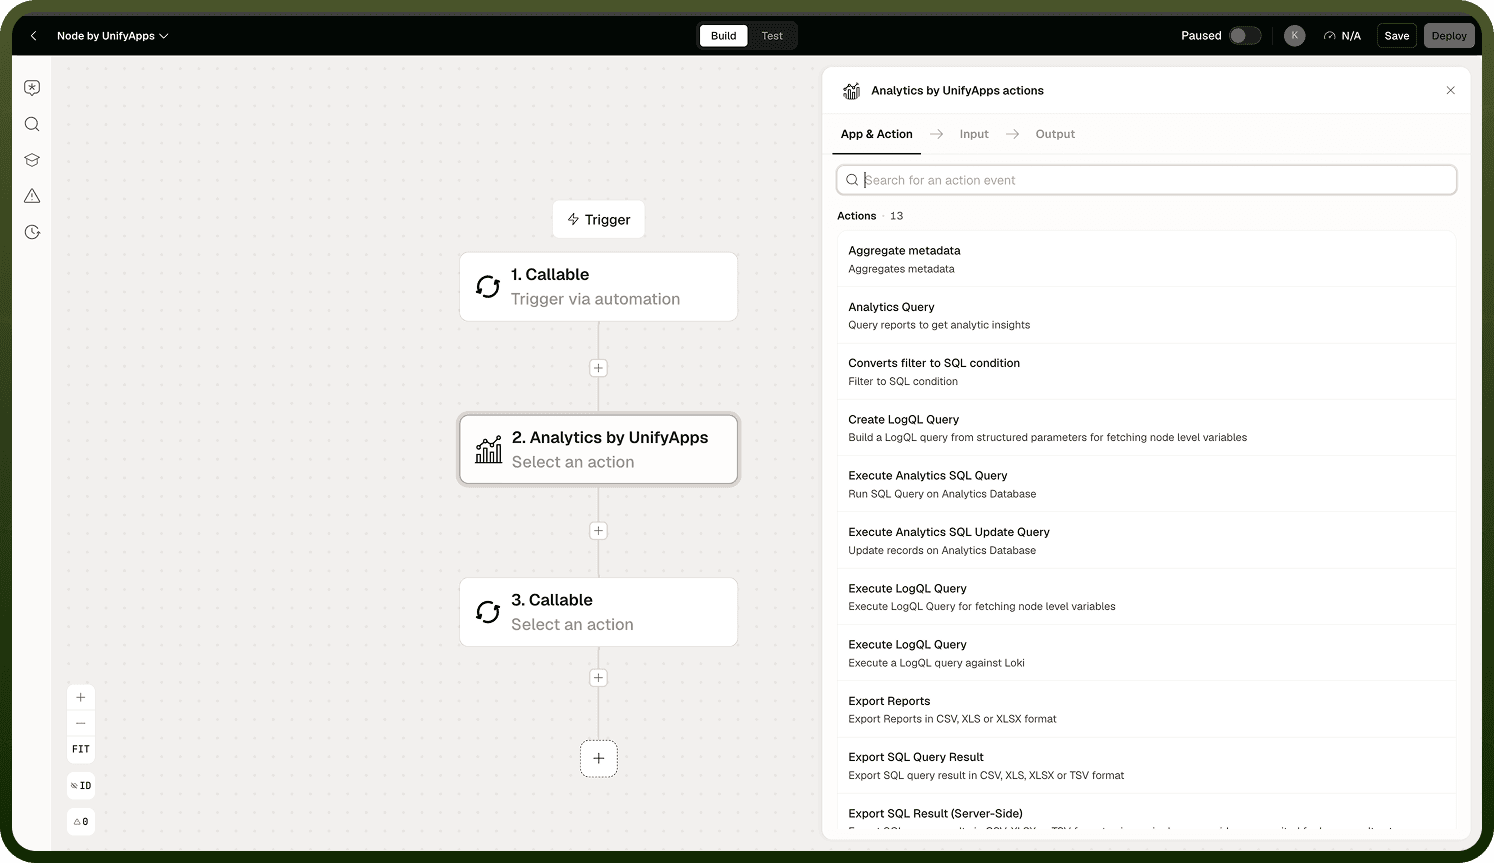
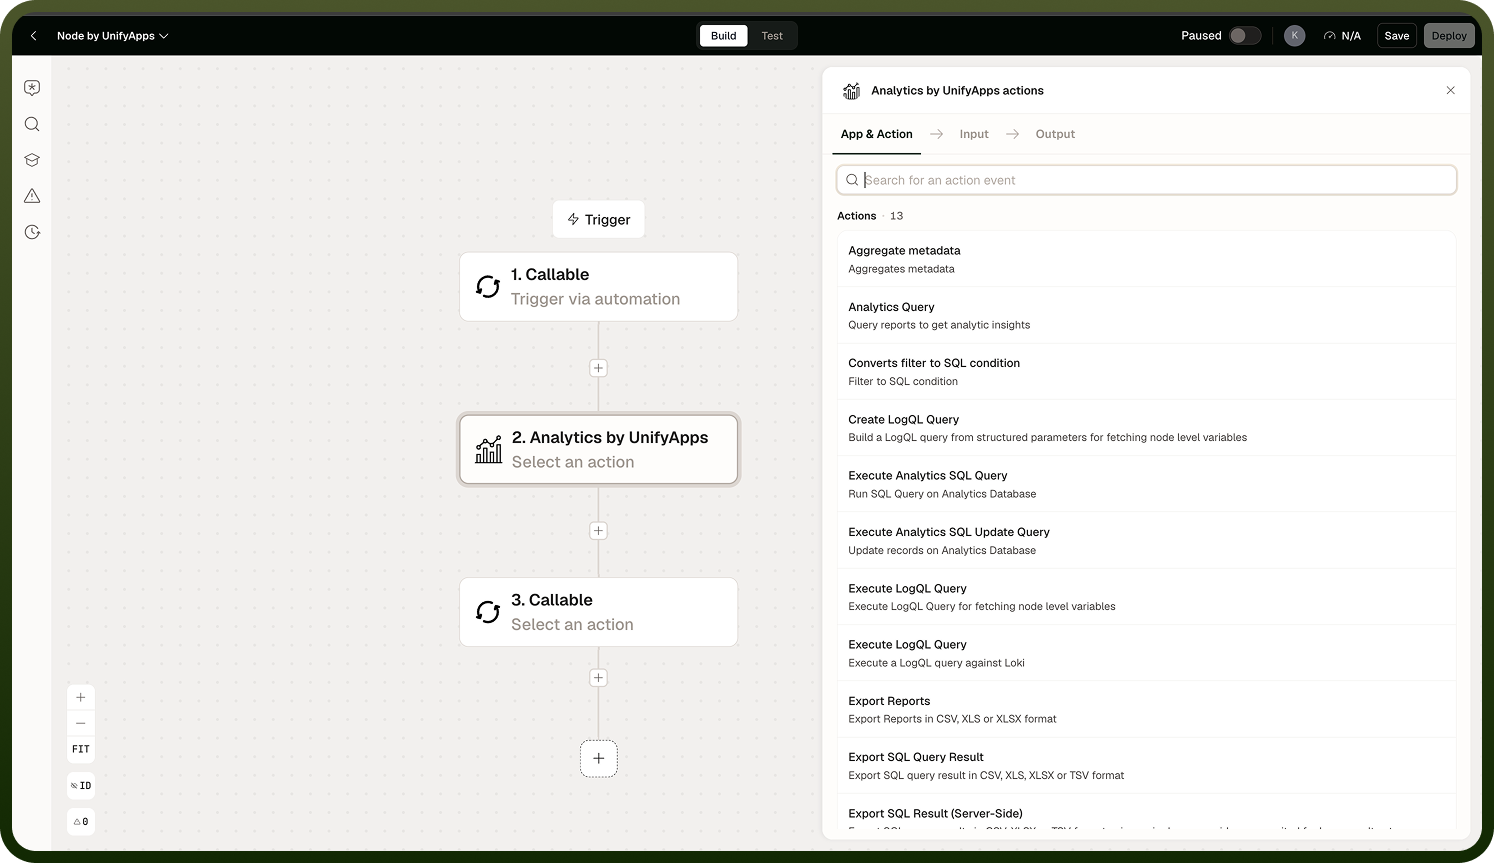
Analytics by UnifyApps enables comprehensive data analysis and reporting capabilities. You can aggregate metadata, run SQL queries, and export reports in various formats (CSV, XLS, or XLSX) for generating insights, performance monitoring, and data-driven decision-making.
Use Cases
Customer Segmentation Analysis — Run analytics queries to group customers by location or purchase history using aggregation functions to identify key demographics and tailor marketing efforts.
Multi-Source Data Integration — Aggregate data from various sources using SQL queries to join tables across multiple platforms and identify patterns and correlations.
Automated Quarterly Budget Reports — Finance teams automate quarterly budget report generation by setting time ranges and defining projections, exporting summarized financial data in XLSX format.
Retrieving Metadata for Specific Fields — Gather detailed metadata for fields such as Customer_Name, Customer_Age, and Customer_Location using the Aggregate Metadata action.
Aggregate Metadata
The Aggregate Metadata action retrieves detailed metadata for data fields within a specific object, providing insights into field properties such as sortability, filterability, searchability, and updateability.
Aggregate Metadata action configuration and output
Input Fields:
Group — Select between Storage or Platform to determine data context
Base Report — Choose the object to query for metadata
Add ID — Specify the field name for metadata extraction
Query — Enter a partial field name to retrieve related metadata (e.g., entering "Cus" returns fields like Customers_Profile)
Page — Configure pagination with Offset and Limit
Sortable — Enable to retrieve sortable fields
Filterable — Enable to retrieve filterable fields
Output includes: Aggregation Field Type, Display Name, Entity Type, Field Type, Sortable, Filterable, and Searchable properties, Updatable status, Name Field indicator.
Analytics Query
The Analytics Query action fetches, processes, and analyzes data from a selected base report with powerful querying capabilities including grouping, filtering, and projecting data.
Input Requirements:
Select Group — Choose Platform or Storage
Select Base Report — Choose the base report object
Select Projections — Choose fields and apply aggregation functions (Count, Sum, Min/Max, Percentage Contribution)
Select Additional Projections — Add supplementary projections
Time Range — Define a time field with start and end times including previous periods for comparison
Filter — Create conditions using fields and values to filter data efficiently
Search Object — Specify fields and their values to narrow down results
Pagination — Use Offset and Limit to manage retrieved records
Sorting — Add fields to sort results by specific attributes
Include Total Count — Set to true for retrieving total count of matching records
Node Level Reporting Overview
Node-level reporting provides 35 distinct metrics for tracking execution details, including: Id, Execution Instance Id, Root and Parent Execution Instance Ids, Trigger Instance Id, Workflow, Workflow Version, Deployed Workflow, Concurrent Execution, Current Node details (name, app name, resource name, connection ID), Next and Previous Node, Entry/Resume/Exit timestamps, Status (RUNNING, COMPLETED, FAILED), Wait Time, Retry Count, Successful/Failed/Total Runs Count, Application Id, Cache Hit, Input/Output (PII), State, Node Execution Count, and Debugged flag.
Execute Analytics SQL Query
The Execute Analytics SQL Query action allows users to directly execute custom SQL queries against their data with granular control and flexibility for advanced analysis.
Execute Analytics SQL Query action configuration
Input Fields:
SQL Query — Enter the SQL query. Prefix table names with ENTITY_ and column names with _pr_ (e.g., Select _pr_columnName from ENTITY_TableName)
Select Group — Choose between Storage or Platform
Define Result Schema — Add fields manually, use a code snippet, or map schema from another step
Export Reports
The Export Reports action generates and exports customized reports with selected data projections, filters, sorting options, and time ranges in CSV, XLS, or XLSX formats.
Export Reports action configuration
Key input fields: File Name (prefix), Group, Base Report, Projections, Time Range, Filter, Search Object, Page (Offset and Limit), Sorts, Include Total Count, File Format (CSV, XLS, or XLSX).
Converts Filter to SQL Condition
This action transforms visual filter inputs into SQL-compatible condition strings for seamless integration of UI-based filter logic into backend SQL queries. Filters support Equals to, Start with, In, and other operators. The output is a SQL-compatible condition string in JSON format that can be appended directly to SQL queries.
Export SQL Query Result
Executes a custom SQL query and exports the result as a downloadable file. Input: File Name prefix, SQL Query, Select Group, and optional Result Schema. Output includes File Type, File Name, Source path, Source Type, a secure download Link, and ua:type (always "FILE").
Execute Analytics SQL Update Query
Modifies existing records in a dataset using SQL UPDATE statements. Input: SQL Query (a valid UPDATE statement) and Select Group. Output: count of records updated.
Notes
Keep the following in mind when using Analytics by UnifyApps:
Prefix table names with ENTITY_ and column names with _pr_ in all SQL queries; omitting these prefixes causes the query to fail.
Use Aggregate Metadata to discover available fields before writing analytics or SQL queries — it avoids trial-and-error when field names are unknown.
Set a narrow time range and a low Limit when testing queries for the first time; expand the scope only after confirming the query structure is correct.
For scheduled reporting, combine Export Reports with a Schedule trigger to generate files automatically at a set cadence.
Node Level Reporting exposes 35 execution-level metrics; filter by Status or Workflow Version to isolate data for a specific deployment.