


Use the Grafana connector to visualize metrics and operational data.
Integrating your application with Grafana lets you use these operations in an automation. It exposes 6 actions, listed below. Add the connector from the Connections area, authenticate, then select its operations in the automation builder. Capabilities: actions.
Authentication
Before you begin, make sure you have the following information:
Connection Name: Choose a meaningful name for your connection. This name helps you identify the connection within your application or integration settings.
Authentication Type: The authentication method for this connector is defined in the connection setup. Select the connector in the Connections area to see the fields it requires.
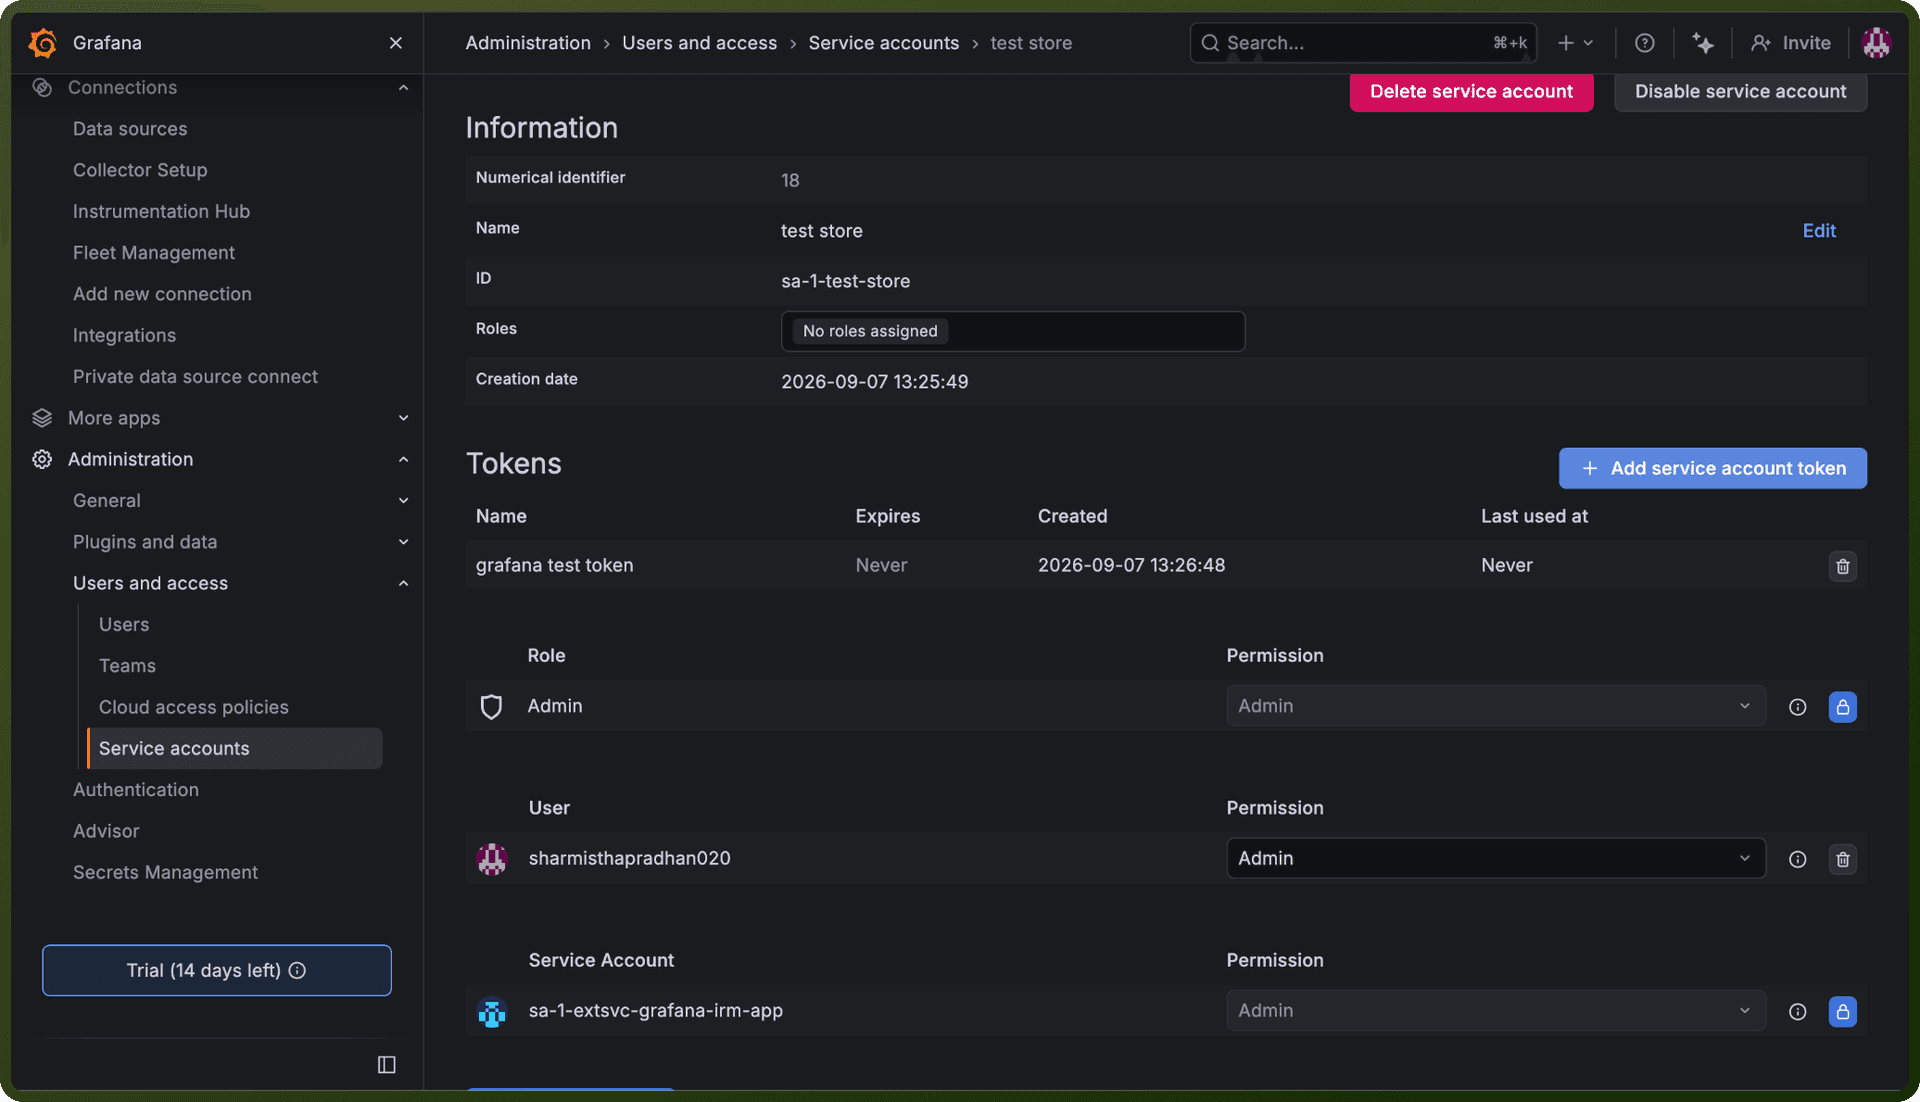
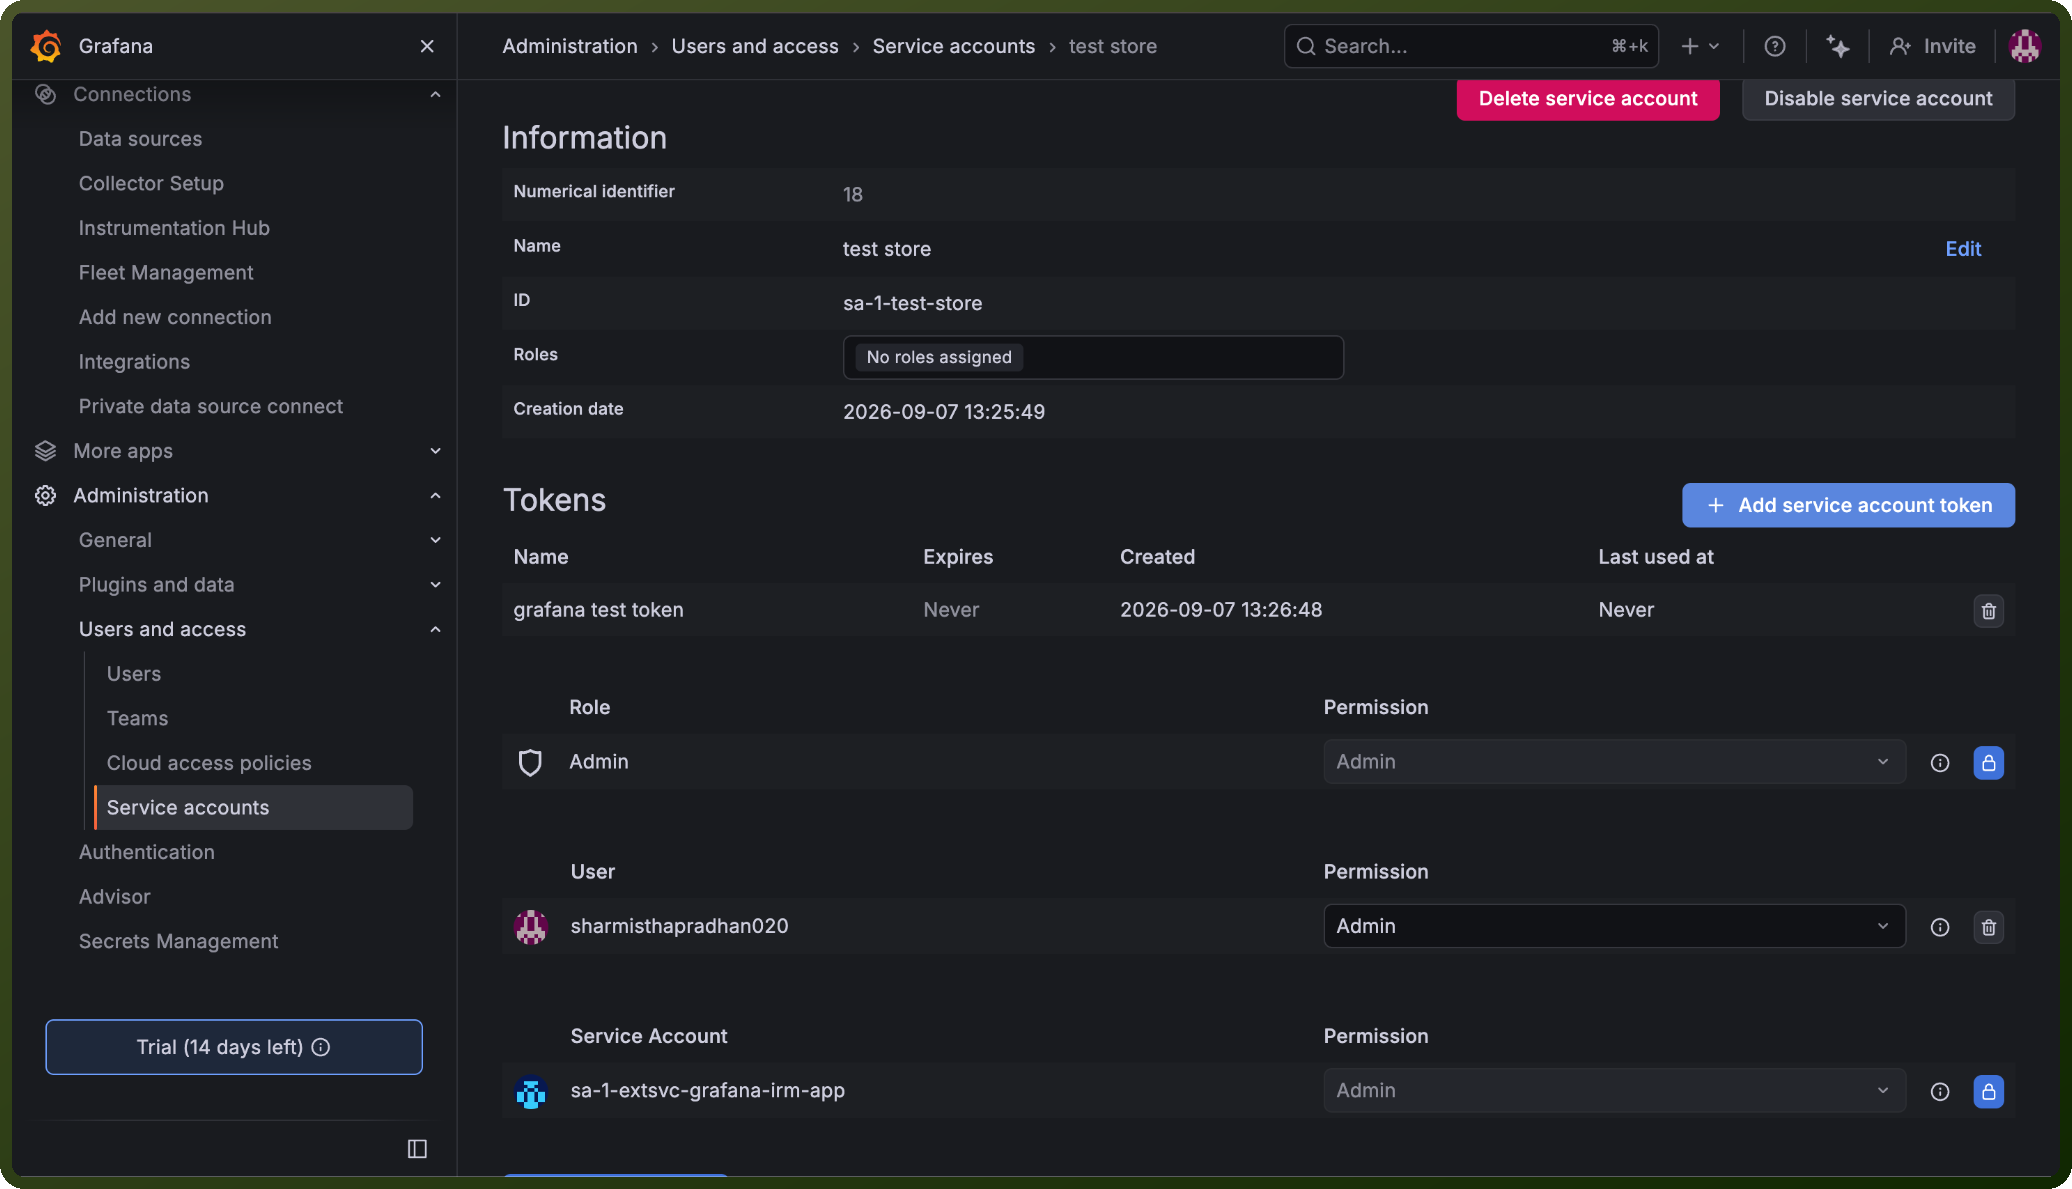
Obtaining Your Service Account Token
Log in to your Grafana instance and click Administration in the left-hand menu.
Go to Users and access, then select Service accounts.
Click Add service account.
Enter a display name and click Create.
Open the service account you just created, then click Add service account token.
Enter a name for the token and click Generate token.
Copy the generated token and store it securely — Grafana will not show it again.
Actions
Action Name | Description |
|---|---|
Delete datasource | Deletes a datasource in Grafana |
Delete folder | Deletes a folder using UID in Grafana |
Get cache configuration of data source | Gets cache configuration of a data source in Grafana |
List folders | Lists folders in Grafana |
Update cache for data source | Updates cache for a data source in Grafana |
Update folder | Updates a folder using UID in Grafana |