


Monitor Your Runs provides a log of every execution of a deployed automation — its timing, status, duration, and a step-by-step breakdown for debugging. Use it after deployment to confirm the automation is running correctly and to diagnose failures.
Overview
Monitor Your Runs provides a comprehensive log of every execution of a deployed automation — its timing, status, duration, and a step-by-step breakdown of each run for debugging.
The Monitor tab is where you go after deployment to confirm the automation is running correctly and to diagnose failures. Every triggered run appears here with its full execution trace, so you can identify exactly which node failed, what input it received, and what error it returned — without re-running the automation.
Note: Runs only appear in the Monitor tab for automations that have been deployed and executed at least once.
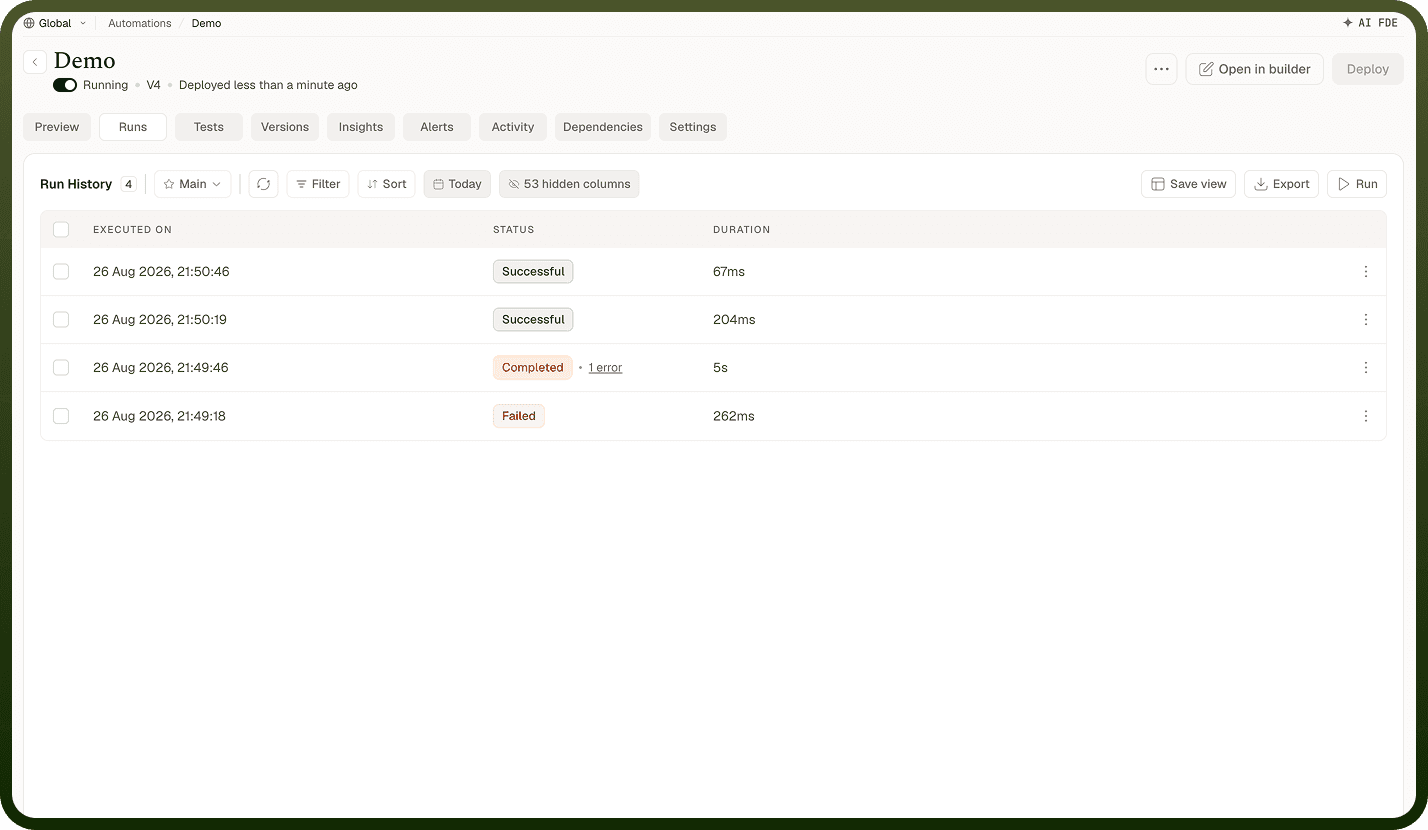
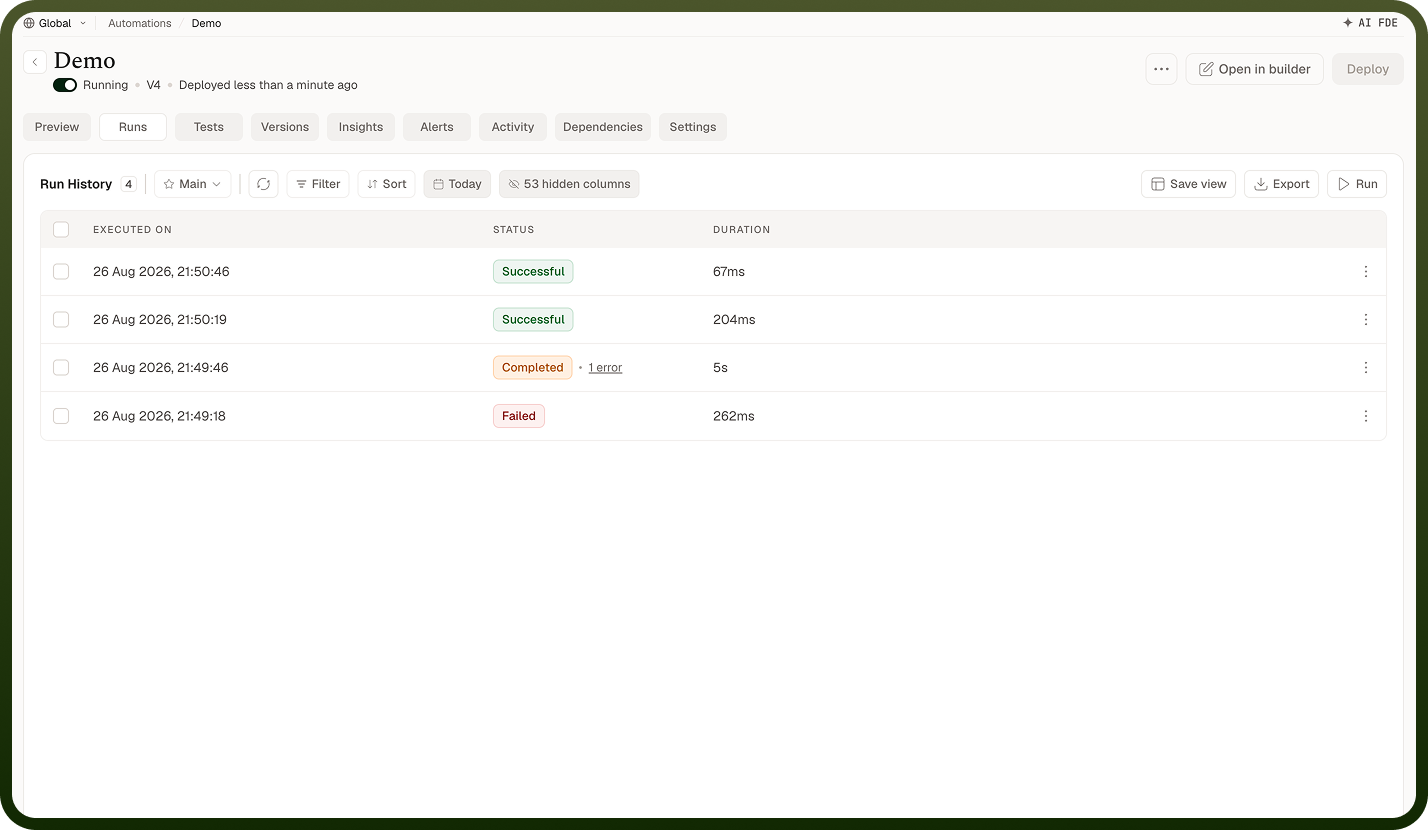
Run History
Each row in the run list shows:
Column | Description |
|---|---|
Total runs | Aggregate count displayed at the top; each row represents one execution |
Executed on | The date and time the run was triggered |
Status | The final state of the run (see status filters below) |
Duration | Total wall-clock time from trigger to completion |
Click any row to open the Run Preview for that execution.
Filter
Filter the run list by status using AND/OR operators to isolate the runs you want to investigate:
Status | Meaning |
|---|---|
Successful | All nodes completed without error |
Failed | At least one node errored and the automation did not complete |
Cancelled | The run was manually cancelled before completion |
In Progress | The run is currently executing |
Skipped | The run was triggered but skipped (e.g., a condition at the trigger level was not met) |
Waiting | The run is paused at a breakpoint or waiting for a scheduled event |
Date Range
Use the date range picker to narrow the run list to a specific window. This is useful when investigating an incident that occurred on a specific date, or when reviewing the performance of an automation over the past week.
Run Preview
Clicking a run opens a canvas view of that execution:
Successful run — Nodes that executed are shown with a green highlight and a checkmark; nodes that were not reached (skipped branches) are shown in gray.
Failed run — The node where execution stopped is highlighted in red with the error message and HTTP status code displayed inline. Select the node to read the full error details.
Cancel a run — For in-progress runs, click the three-dots menu on the run row and select "Cancel" to stop the execution immediately.
Notes
Monitoring is the production phase of the automation lifecycle — it tells you whether your deployed automation is doing what you intended. To monitor effectively:
Filter to "Failed" runs first after any deployment to catch immediate issues before they accumulate.
Use the date range filter when responding to an incident report — narrow to the time window the user reported the issue in rather than scrolling through all runs.
Click through to the failed node's Error tab for the exact HTTP response — the status code and message usually point directly to the fix.
Set up a monitoring automation that queries run history and alerts on an elevated failure rate, rather than checking manually.
A clean monitor view — mostly Successful with occasional transient failures — is the confirmation that an automation is production-ready.