


The Insights dashboard is the API Manager's health view — it shows how your published APIs are being used, aggregated from the requests they handle, so you can spot problems and understand traffic patterns at a glance.
Overview
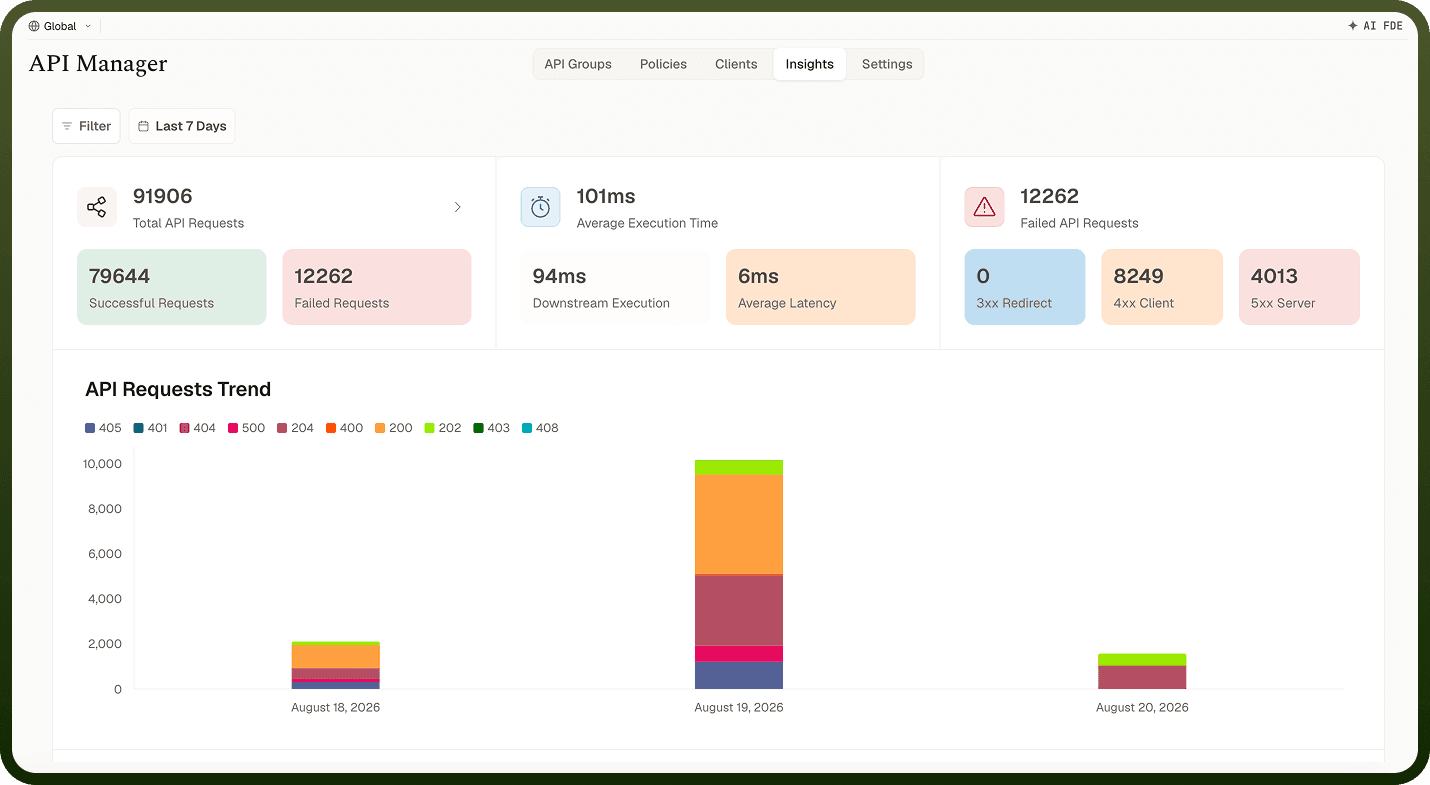
Every request your managed APIs receive is recorded and rolled up into the Insights view. You get call volume, latency, error rates, and cache performance for every endpoint and collection — broken down by client and response status. Use Insights to confirm a new endpoint is being called, detect a rising error rate, identify which client is driving unexpected traffic, or catch latency regressions after a change.
API Manager Insights dashboard showing call volume, latency, and error rate
Where: API Manager › Insights
What Insights Shows
The dashboard surfaces the following metrics across your published APIs:
Metric | What It Tells You |
|---|---|
Call volume | Number of requests per endpoint, per collection, and over time. Use to see which APIs are most active and whether traffic is growing or dropping. |
Latency | Typical and worst-case response times. Use to catch slowdowns in the backing resource or in policy processing. |
Error rate | The share of failed calls and which errors are occurring. Use to detect broken endpoints or clients sending bad requests. |
Cache hit rate | How effectively response caching is reducing calls to the backing resource. Use to verify your cache TTL and key configuration are working as intended. |
Client breakdown | Traffic and errors split by access profile. Use to identify when a specific consumer is responsible for a spike. |
Endpoint breakdown | Per-endpoint view of all the above. Use to isolate a problem to one operation rather than an entire collection. |
Response status breakdown | Distribution of HTTP status codes. Use to distinguish authentication failures (401), access errors (403), and resource errors (500) at a glance. |
Common Use Cases
Confirm a new endpoint is live — after publishing, check Insights to verify call volume is non-zero and the error rate is as expected.
Spot rising errors — an upward trend in the error rate on one endpoint points to a change in the backing automation or a shift in how clients are calling it.
Identify a high-traffic client — the client breakdown shows which access profile is driving volume, useful when investigating whether a rate limit is being approached.
Verify caching is working — the cache hit rate confirms whether your TTL and cache key settings are serving repeat requests from cache rather than invoking the backing resource each time.
Detect latency regressions — compare worst-case latency before and after a deployment to catch performance regressions in the backing automation.
Using Insights to Debug
Insights is the first step in debugging an API issue. It tells you that something is wrong and roughly where:
Check the error rate on the affected endpoint to confirm the issue is real and ongoing.
Look at the response status breakdown — the HTTP status code identifies which pipeline stage rejected the request (authentication, routing, a policy, or the backing resource).
Use the client breakdown to determine whether the problem affects all callers or just one access profile.
Once you know which requests to investigate, switch to Traceability to find and inspect the specific calls.
Notes
The response status code is always the first diagnostic clue — use the Response Code Reference in the Request Lifecycle page to map it to the right pipeline stage.
Check the cache hit rate after enabling response caching on an endpoint to confirm the configuration is working as intended.
Use the client breakdown to identify when a single consumer is responsible for a traffic or error spike before applying additional rate limits.
Insights shows aggregated data — pair it with Traceability when you need to investigate a specific individual request.