


Traceability captures per-request detail so you can find and investigate a specific API call. Where Insights shows you aggregate patterns, traceability answers the question: "What exactly happened to this one request?"
Overview
Traceability has two parts: custom trace headers that let you locate a specific call by a correlation ID the caller sends, and workflow logging that controls how much of the backing automation's execution is recorded. Together they give you the context needed to reproduce and diagnose issues at the individual request level. Configure traceability at the collection level; individual endpoints can override the logging settings.
Traceability configuration panel in API Manager Settings
Where: API Manager › Settings › Traceability
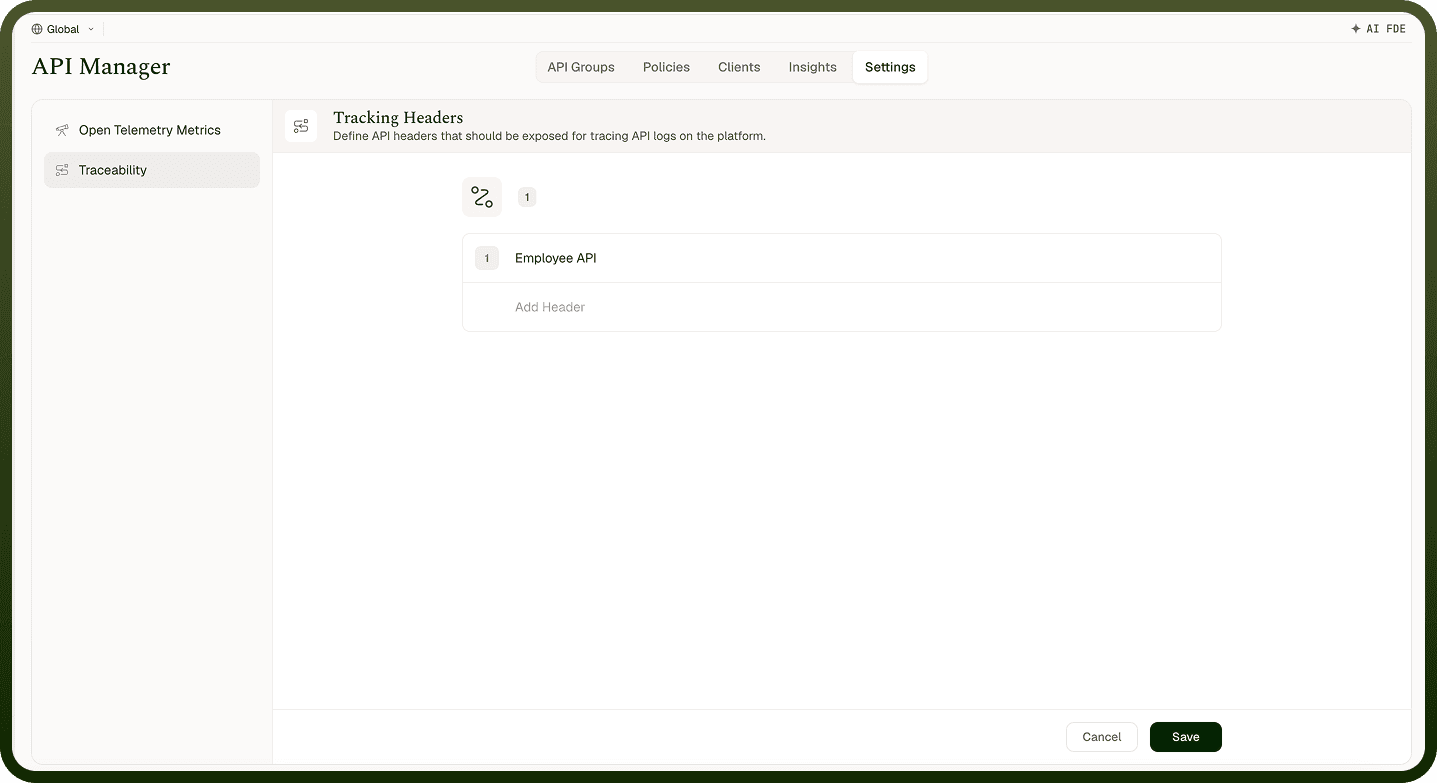
Custom Trace Headers
Callers often include a correlation or request ID in an HTTP header — for example, x-correlation-id or x-request-id — so they can tie a specific request to what they observe on their end. By listing these headers in the traceability configuration, you tell the platform to capture and store them with each request's record.
Once captured, you can use the correlation ID to locate the exact call in the request logs and trace it across systems — matching it to what the caller reported, what the backing automation logged, and what any downstream services received.
Configure trace headers before a problem occurs. Adding them after the fact means you cannot retroactively find past requests — only calls received after the header is configured will carry it in the record.
Workflow Logging
Workflow logging controls how much of the backing automation's execution is recorded for each API call. Three levels of logging can be configured:
Log Level | What Is Recorded | When to Use |
|---|---|---|
Run logging | Whether the automation run succeeded or failed, and its overall outcome. | Always-on baseline — low overhead, gives you pass/fail for every call. |
Node (step) logging | The result of each individual step in the automation — which nodes ran, in what order, and what each returned. | When you need to see where in the automation a failure occurred. |
Variable logging | The values of variables at each step of the automation's execution. | Deep debugging — use temporarily when you need to inspect the exact data flowing through the automation. |
Set logging at the collection level as your default. Individual endpoints can override this — raise logging on a specific endpoint you are actively debugging, then lower it again once the issue is resolved.
Debugging a Specific Call
Use traceability as the second step after Insights identifies a problem:
Locate the call — use the correlation ID captured from the caller's trace header to find the specific request record in the logs.
Check the response code — the HTTP status tells you which pipeline stage failed: authentication (401), access control (403), a policy (400/429), or the backing resource (408/500).
Inspect the automation run — with node and variable logging enabled, drill into the backing automation's execution to see exactly which step failed and what data it had at that point.
Notes
Configure custom trace headers on every collection from the start — you cannot retroactively capture them for past requests.
Raise node and variable logging on an endpoint you are actively debugging, then lower it back to run-only once the issue is resolved. High logging on a high-traffic endpoint stores significant data.
Traceability operates at the collection level by default; use per-endpoint overrides to increase detail only where needed rather than on the entire collection.
Combine trace headers with the Insights dashboard: Insights tells you that something is wrong, the correlation ID helps you find the exact call, and the workflow logs show what the automation did for it.