


Open Telemetry Metrics is the metric-collection layer that gathers data from your API traffic and feeds it to the Insights dashboard and any connected monitoring system. You define exactly what gets measured, which calls it applies to, and how the data is broken down.
Overview
By default, the platform records request data for every managed API. Telemetry configuration lets you go further: define custom metric configurations that count events or measure durations, filter to only the calls you care about, and slice the results by dimensions like endpoint, client, or HTTP method. You can set a global configuration that applies across all collections, and override it per collection for APIs that need different measurement.
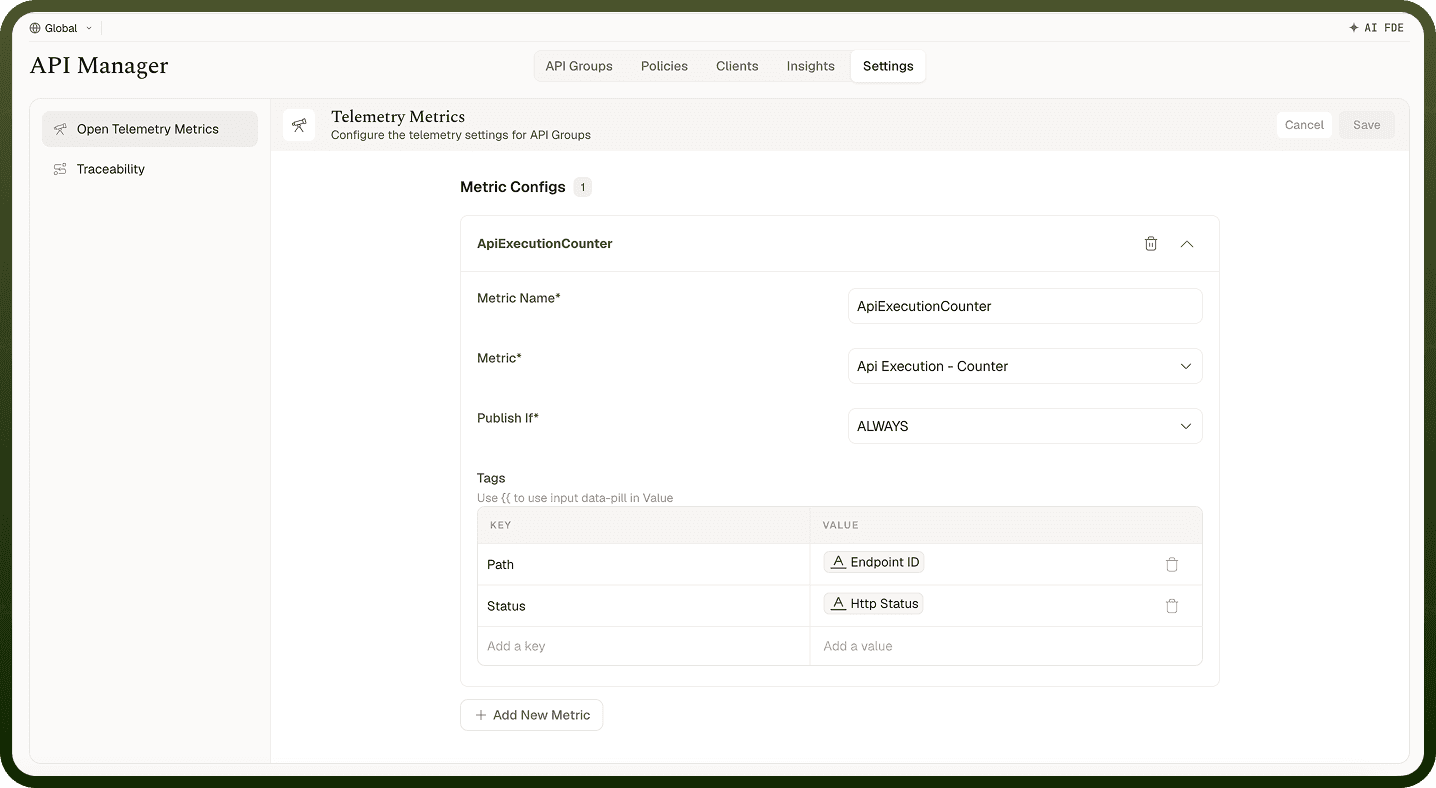
Open Telemetry Metrics configuration panel in API Manager Settings
Where: API Manager › Settings › Telemetry
Metric Types
Each metric configuration is one of two types:
Counter
A counter counts events. Use it to track how many times something happens — for example, the number of requests received, the number of 4xx responses returned, or the number of rate-limit rejections. Counters increment on each qualifying event and are useful for volume and frequency analysis.
Timer
A timer measures duration. Use it to record how long something takes — for example, the end-to-end response time for a specific endpoint, or the time spent in policy processing. Timers capture both typical and worst-case values, which appear in the Insights dashboard's latency view.
Conditions
Every metric configuration carries a condition that decides which API calls the metric applies to. The condition acts as a filter — only calls matching it are counted or timed.
Examples of conditions:
"Count only responses with status 400 or higher" — to track error events specifically.
"Time only calls to a specific endpoint" — to measure latency for one operation.
"Count only requests from a given access profile" — to track a specific client's volume.
Conditions keep your metrics precise. Without them, every metric would apply to all traffic, making it harder to identify what's driving a specific number in the dashboard.
Dimensions
Dimensions break a metric down so you can see it sliced by a property of each request. Configure dimensions to add useful segmentation to your counters and timers:
Dimension | What It Adds |
|---|---|
Endpoint | Splits the metric by the API operation that was called. Use to identify which endpoints drive errors or latency. |
Client | Splits by the access profile making the request. Use to identify which consumer is responsible for volume or error spikes. |
HTTP method | Splits by GET, POST, PUT, DELETE, etc. Use when one verb behaves differently from others. |
Response status | Splits by HTTP status code. Use to distinguish 4xx client errors from 5xx server errors in the same metric. |
Global vs. Per-Collection
Telemetry configuration can be applied at two scopes:
Global — applies to all collections as the default. Set global configurations for metrics you want across every API you publish.
Per collection — overrides the global configuration for one collection. Use this when a specific API needs different metric types, conditions, or dimensions than the global default. A collection-level configuration replaces the global one for that collection — it does not layer on top.
This scope model means you define once for the common case and override only where needed, without duplicating configuration across every collection.
Notes
Configure telemetry deliberately — measure what matters rather than collecting every possible metric, which adds processing overhead and storage cost.
Add a client dimension to your error-rate counter so you can identify whether a spike comes from one consumer or all of them.
A collection-level telemetry override replaces the global configuration entirely for that collection — any global metric configurations you want to keep must be re-specified in the override.
Pair telemetry with Traceability: telemetry shows aggregate trends; traceability gives you the per-request detail to investigate the cause.