


The Run Detail view shows a step-by-step replay of a single automation execution — every node annotated with its inputs, outputs, timing, and any error it produced — so you can diagnose failures without re-running the automation.
Overview
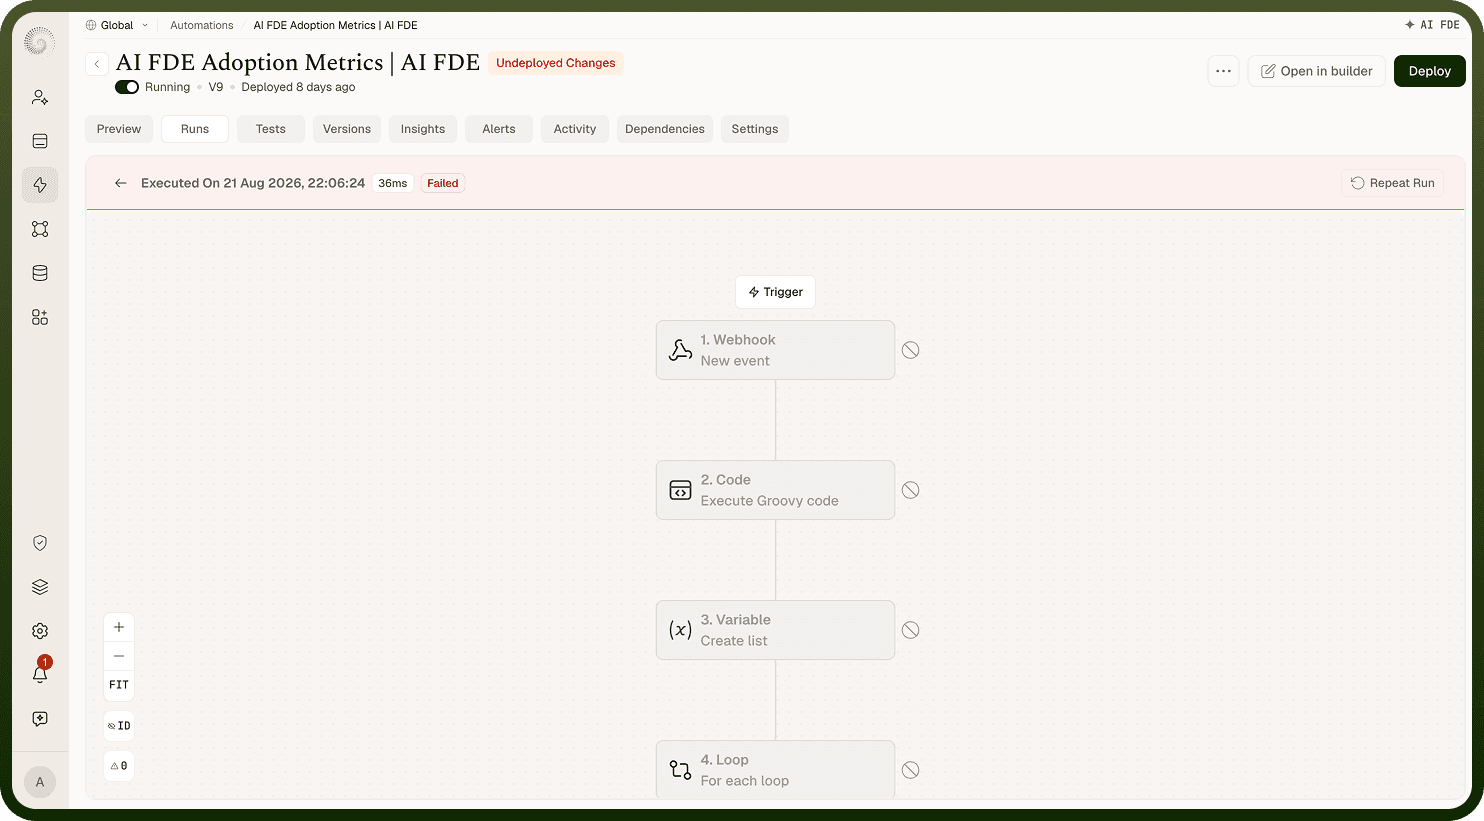
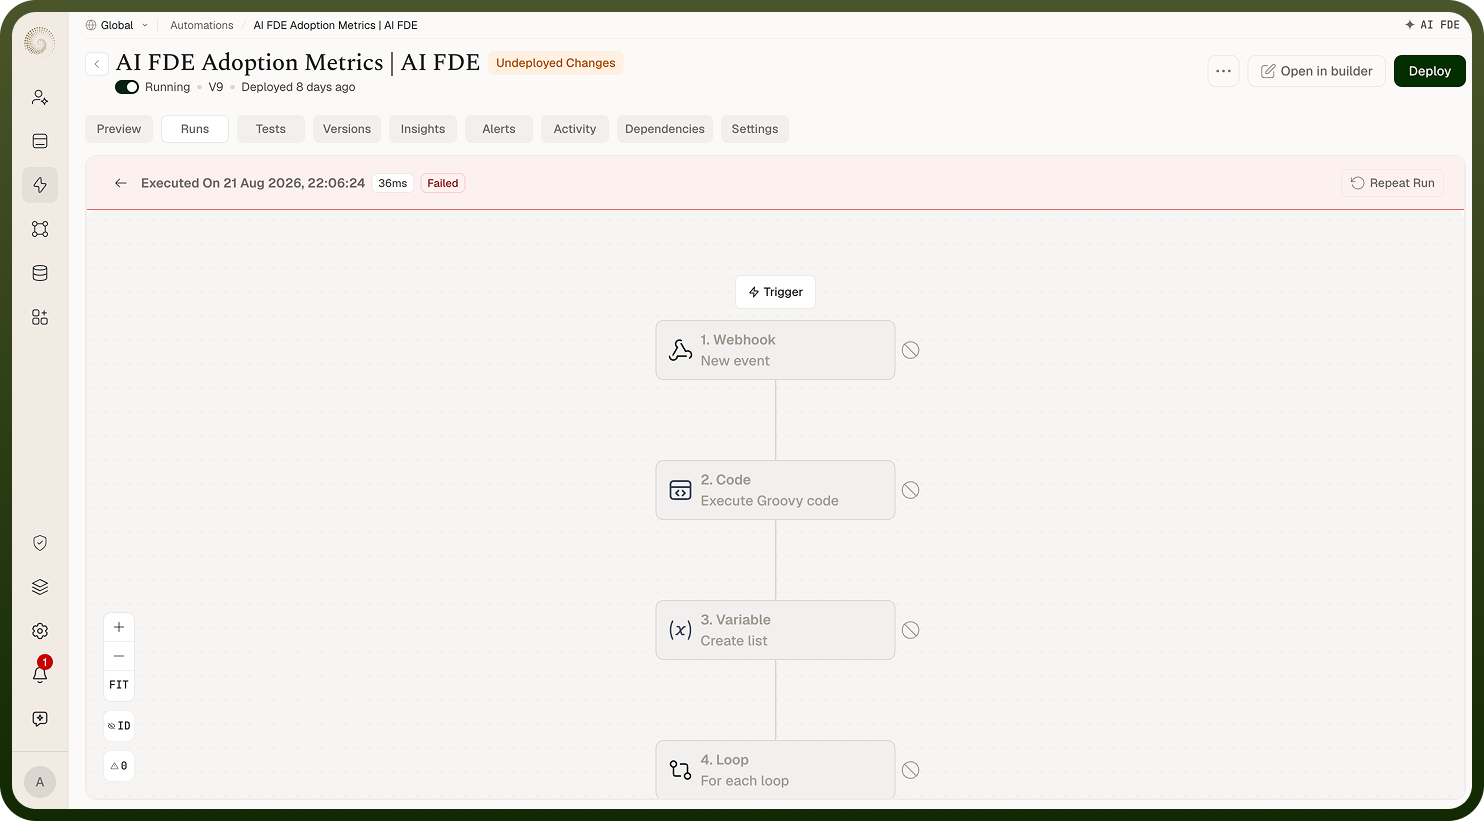
The Run Detail view gives you a step-by-step replay of a single automation execution. Every node that ran is drawn on a read-only canvas exactly as it appeared in the builder, annotated with what it received, what it returned, how long it took, and whether it succeeded or failed. You do not need to re-run the automation to diagnose a problem — all the information is captured at execution time.
Note: Step-level inputs and outputs are only visible when Step Details logging is enabled for the automation. If you see Step Details not enabled or Full Trace is turned off inside a run, enable the corresponding setting in the automation's settings to capture this data on future runs.
Opening the Run Detail View
You can open a run's detail view two ways from the Run History list:
Click any row in the Run History list to open the run inline.
Hover a row to reveal the open-in-new-tab icon and click it to open the run detail in a separate browser tab.
The Run Detail view opens a read-only canvas replaying that execution. A header at the top shows:
Executed On {date and time} — or Cancelled on {date} for cancelled runs.
A duration pill showing the total execution time.
A status pill reflecting the run's final outcome.
The header is tinted to match the outcome — for example, a failed run header appears in red, while a successful run header is neutral or green.
Step Execution Details
Click any step on the canvas to open its detail panel. The panel shows:
The inputs the step received — the exact data passed into it from the trigger or an upstream step.
The outputs the step returned — the data available as data pills for downstream steps.
The error the step produced, if it failed — including the error message and any additional context returned by the connected system.
From any step's detail panel, you can use Copy step inputs or Copy step outputs to copy the raw JSON to your clipboard.
For steps that belong to a sub-automation, the detail panel includes a link that takes you directly to the child run's detail view.
Step Timing
Each step's detail panel includes a timing entry that tells you how long that individual step took. The possible timing states are:
Timing Display | Meaning |
|---|---|
This step took {time} to execute / From {start} to {end} | The step completed. The exact start and end timestamps are shown below the duration. |
This step is still processing | The step has not yet finished — the run is still in progress. |
This step was cached & took {time} to execute | The step's result was served from cache rather than executing a live request. |
This step was not executed | The step was not reached — typically because an upstream branch condition was not met. |
Retries and Loop Iterations
Retries
If a step was configured to retry on failure, each attempt appears as a separate entry in the step's detail panel, labeled Retry #1, Retry #2, and so on. This lets you compare inputs and error messages across attempts to determine whether the failure was transient or persistent.
Loop Iterations
For steps inside a loop, the detail panel shows which iteration you are viewing — for example, Iteration 2 of 5. Use the View all iterations option to browse every iteration of the loop, which is useful when a failure only occurred on a specific item in a list.
Reading Errors
A step that failed displays the error it returned, along with the inputs it received at the time. This combination — what was sent and what error came back — is usually sufficient to identify the root cause:
A bad or missing mapped value causes the step to receive unexpected input.
A downstream system rejecting the request surfaces as an error code or message in the step's output.
For a run with status Completed (finished but with one or more step failures), the run header shows a clickable N errors link. Clicking it opens the Steps with errors popover, which lists exactly which steps failed. Click any entry in the popover to jump directly to that step on the canvas.
Notes
The Run Detail view is your primary debugging surface for production automation failures. To make the most of it:
Enable Step Details and Full Trace in the automation's settings before you need to debug — these settings only affect future runs and cannot retroactively add detail to past executions.
Use Copy step outputs on a healthy upstream step to confirm the data shape before checking why a downstream step failed.
For loops, always use View all iterations rather than inspecting only the first iteration — failures on partial data often appear only on specific items in the list.
For sub-automation steps, follow the child run link to inspect the nested execution separately rather than trying to infer what happened from the parent run alone.
Use the open-in-new-tab icon when comparing two runs side by side — each run opens in its own tab so you can switch between them without losing your place.