


Metric-based alerts that watch your automations, pipelines, connections, and APIs.
Overview
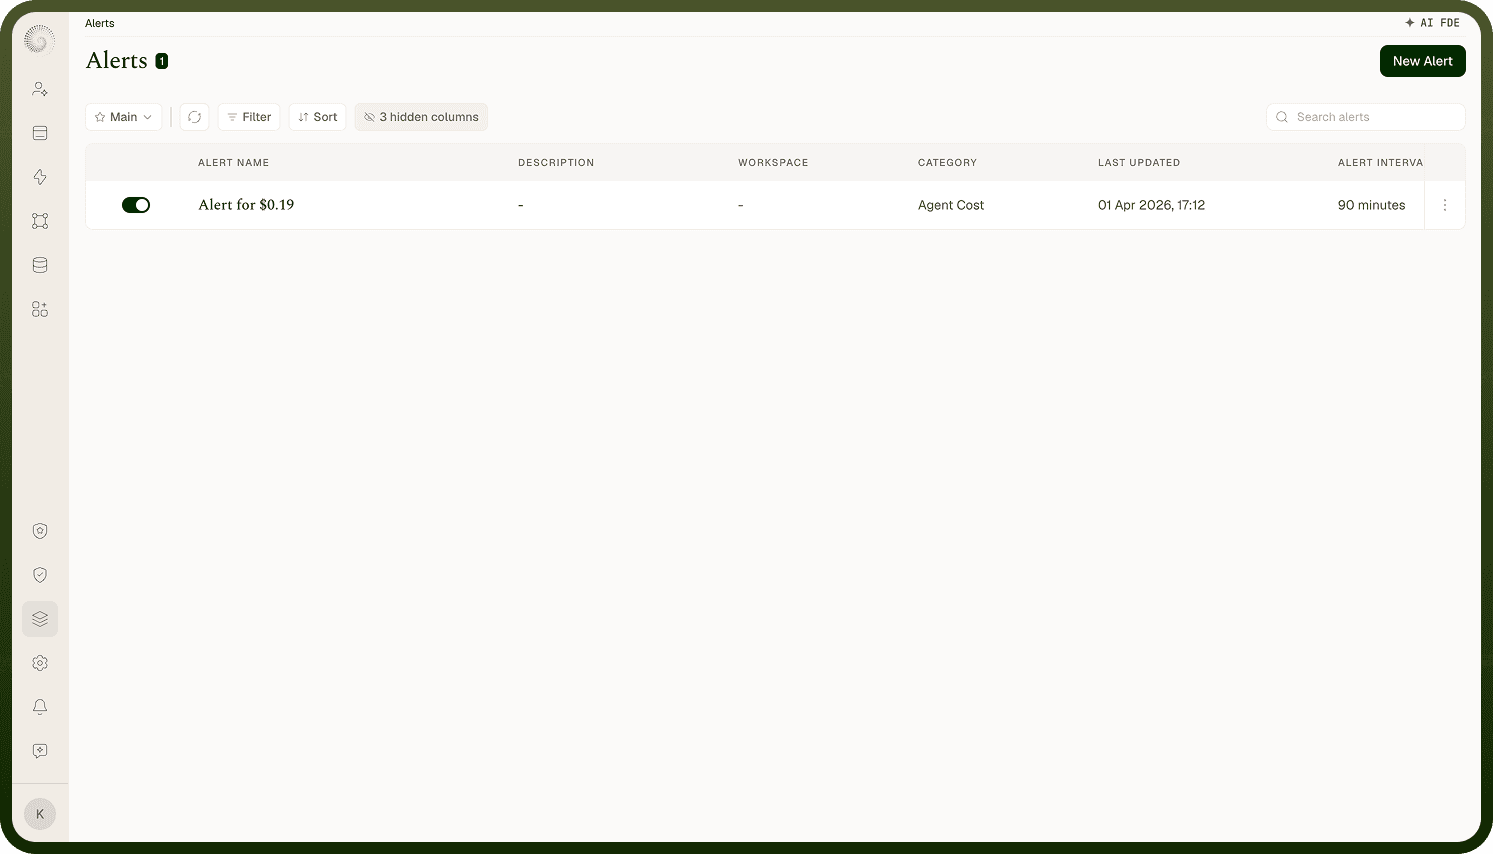
Settings › Alerts lists every alert definition on the platform: a table with an on/off toggle per alert, Alert Name, Description, Workspace, Category, Alert Interval, and Last Updated, plus search ("Search alerts"). Row actions Edit, Share, and Delete appear per your permissions, and New Alert creates one. The same alerts also surface on individual assets (for example an automation's Alerts tab shows just its alerts) — this screen is the global view. Flip the toggle to pause or resume an alert without deleting it.
Where: Settings › Alerts
Creating an alert
New Alert opens the alert form:
Details — Name (required, "Enter a unique name for the alert"), Workspace, and Description.
Define category & metrics — pick the Category (what to watch): Automation, Automation Nodes, Pipelines, Connection, API Endpoint, or the AI-agent categories Agent Cost and Agent Metrics. Then pick the Metric for that category (e.g., for Automation: Total Runs, Successful Runs, Failed Runs, Completed Runs, Execution Time, Wait time; for API Endpoint: Total requests, Failed Executions, Policy violations count; for Pipelines: Read Latency, Load Failed/Skipped/Successful), an Aggregation (Count, Distinct Count, Sum, Avg, Min, Max), and optionally Group By dimensions.
Alert Interval — how often the alert is evaluated: a number of Minutes, Hours, or Days (default 10 minutes). Each evaluation aggregates the metric over the interval and compares it to your thresholds.
Filters — narrow which records of the category count (for example only a specific automation or connection).
Where: Settings › Alerts › New Alert
How thresholds and statuses work
An alert has three statuses — Critical, Warning, Resolved — configured as threshold rows. You choose the comparison operator and value on the Critical row (e.g., failed runs > 10); Warning takes its own value with the same operator; Resolved is derived automatically as the inverse (if Critical is "greater than", Resolved becomes "less than or equal"), marking recovery. On each evaluation the metric lands in one of the statuses, and the actions you attached to that status fire.
Where: Alert form › thresholds
Actions
For each status (Critical Status, Warning Status, Resolved Status) you add one or more Actions:
Email — send to the email addresses you list (required for this type).
Notification — an in-platform notification to a User (pick users) or a Team (pick user groups).
Custom — run any connector action: pick the app and action, its connection, and map the inputs (alert data is available as pills) — e.g., post to Slack or open a ticket.
So a single alert can email on-call on Critical, notify the team on Warning, and post a recovery message on Resolved.
Where: Alert form › status actions