


Where every Insights dashboard lives, what they share, and the workspace-wide automations dashboard.
Overview
Almost every module has an Insights surface, always as a tab next to the module's asset list:
Project — the cross-module dashboard under Reporting › Insights in a project's side navigation.
Automations — an Insights tab on the Automations manager (all automations, covered below), plus an Insights tab on each automation's detail view.
Pipelines and Event Streams — an Insights tab on each manager.
Connections — an Insights tab summarizing connection health and usage.
API Manager — an Insights view of published-API traffic.
Applications — a per-app Insights tab (shown only when app analytics is enabled for that app).
Users — Insights and Activity tabs under Settings › Users.
AI — agents have their own Observability (sessions, traces, spending) and workspace AI metering pages.
Where: each module's manager, Insights tab
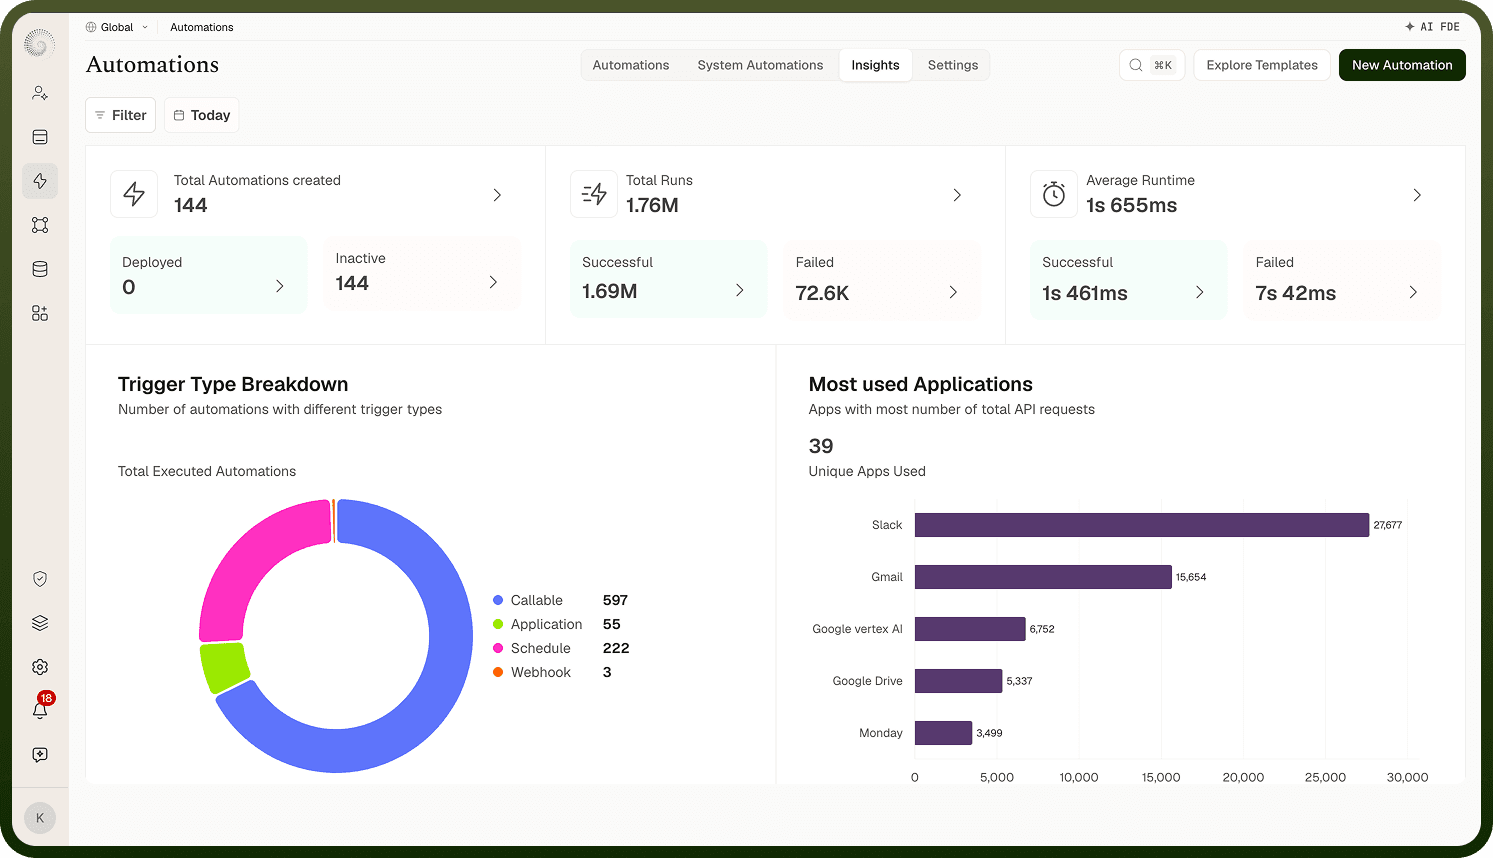
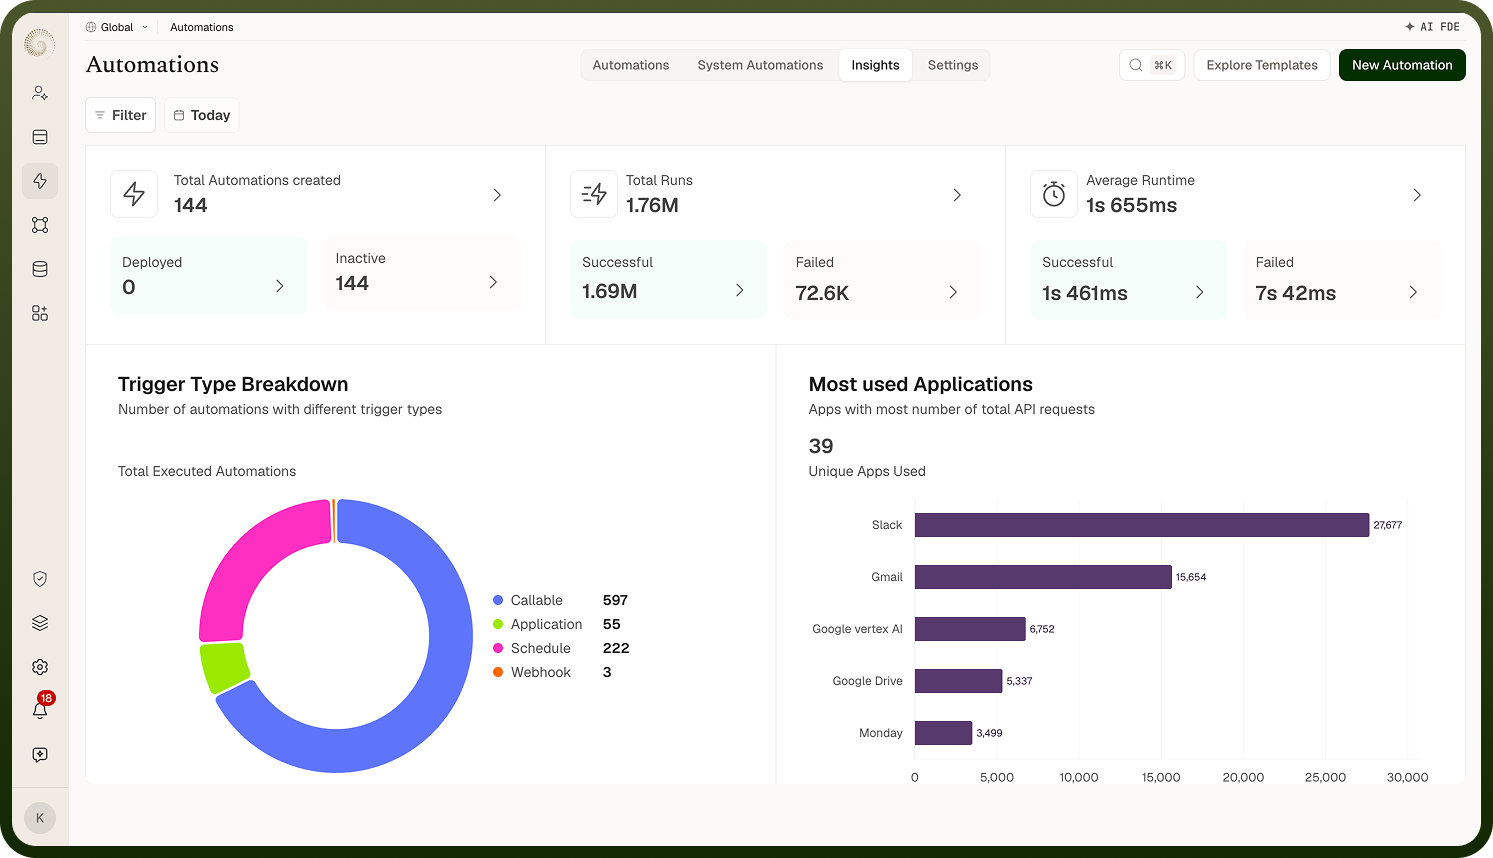
Automations manager Insights tab
Where an automation's own Insights tab covers one automation, the manager-level Insights tab aggregates across all of them: Total Automations, Deployed Automation, Inactive Automations, and Total Executed Automations counts; Total Runs, Successful Runs, and Failed Runs; Average Runtime, Average Successful Runtime, and Average Failed Runtime; an Automation Runs over time chart; a Trigger Type Breakdown pie ("Number of automations with different trigger types" — click a slice to list automations with that trigger); Unique Apps Used and a Most used Applications bar chart ("Apps with most number of total API requests"); and a Recent Automations list. A date filter (default last 7 days) plus an attribute Filter scope the page, and metrics drill down to the underlying automations and runs.
Where: Automations manager › Insights