


Unify Automations tracks two categories of run metrics that feed the Insights dashboard: run counts (how many runs happened and how they ended) and run duration (how long runs take). Together these tell you volume, reliability, and speed for each automation.
Overview
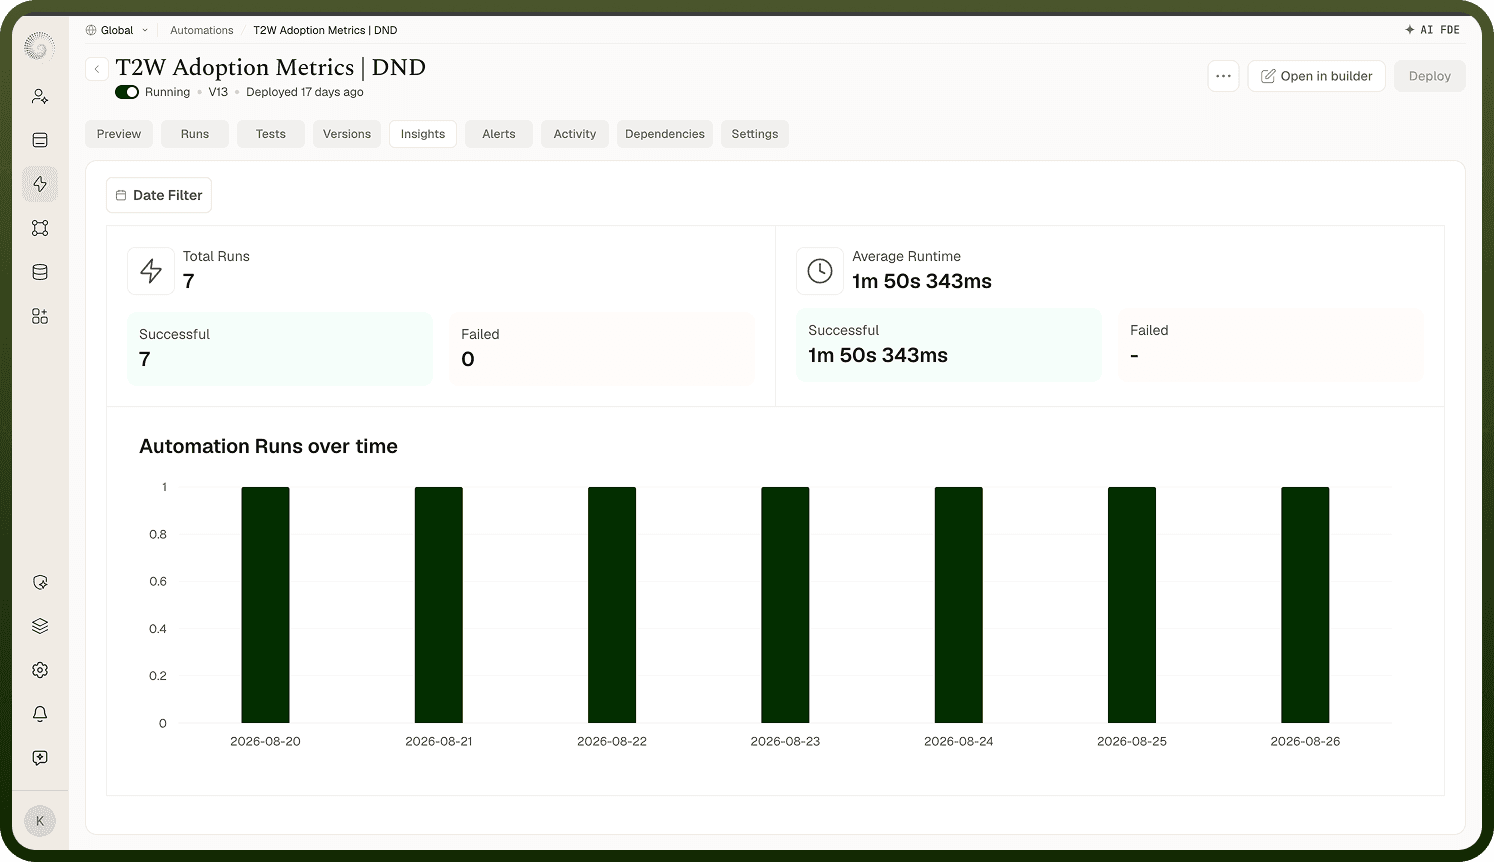
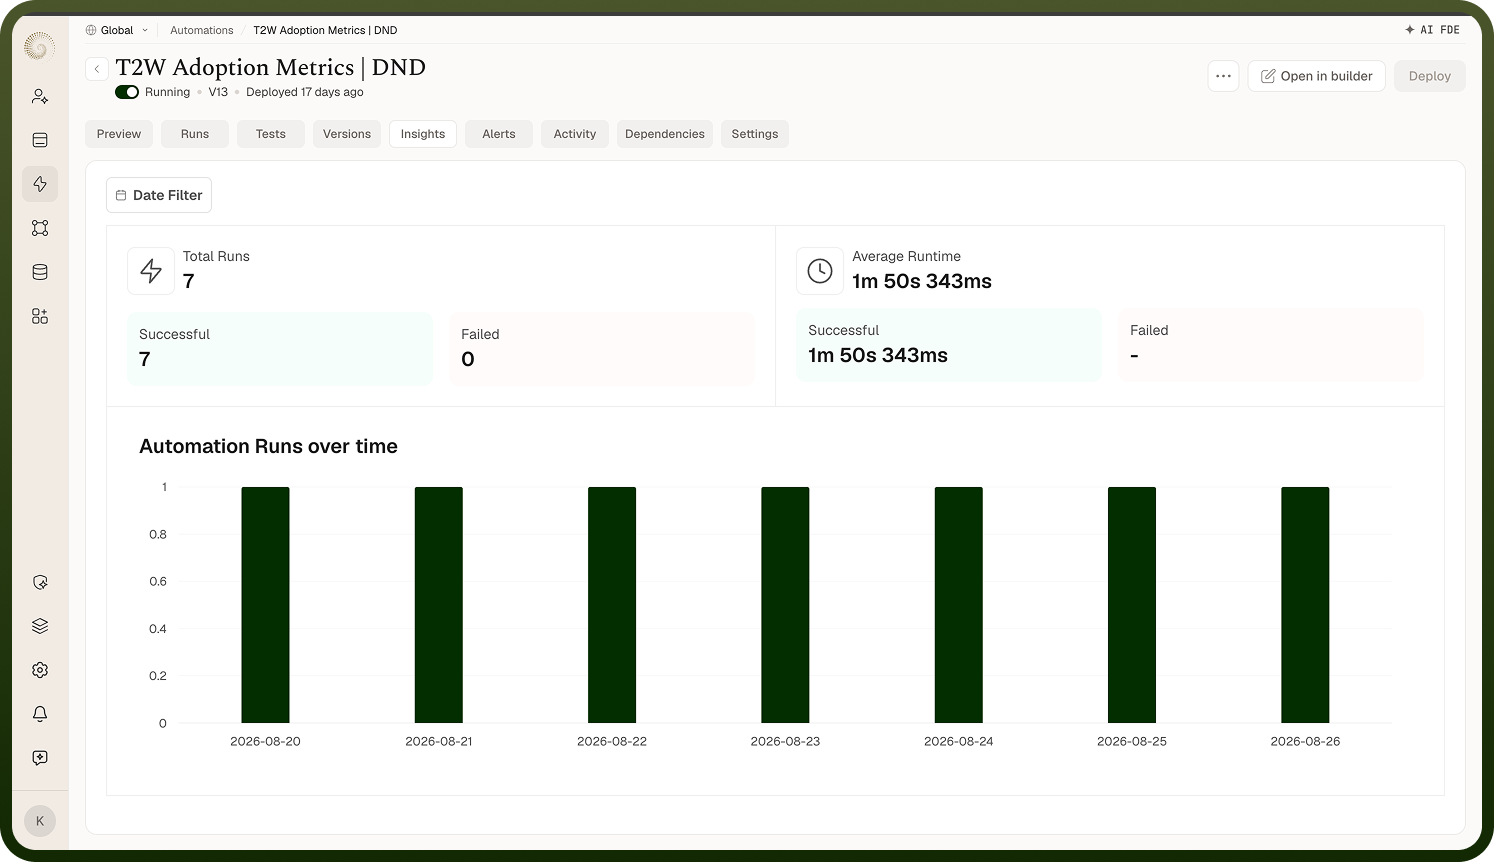
The Insights tab is a read-only dashboard of an automation's performance over time. Rather than listing individual executions the way the Runs screen does, Insights aggregates across many runs into metrics and trends — totals, success/failure rates, and durations over a period — so you can judge overall health at a glance.
Insights is built from two kinds of run metrics:
How many runs happened and how they ended — counts broken down by run status (successful, failed, and so on).
How long runs take — run duration.
Because the metrics come from recorded runs, they only reflect executions that were logged. If you turn run logging off, new runs will not contribute to Insights.
Run Count Metrics
Run count metrics tell you how many times an automation executed and how those executions ended. Each run is recorded with a status, and Insights rolls these up into totals and breakdowns over the selected time period.
Run Statuses
Every run is assigned one of the following statuses, and run count metrics break down totals by these categories:
Status | Meaning |
|---|---|
Successful | The run finished cleanly with no errors. |
Failed | The run encountered one or more errors and did not complete successfully. May read "Failed with N errors." |
Completed | The run finished, but one or more steps failed along the way (shown in a warning color). |
Cancelled | The run was stopped before finishing. |
In Progress | The run is still executing. |
Waiting | The run is queued, waiting on a delay or an external response. |
By reviewing how runs distribute across these statuses, you can spot trends such as a rising failure rate or a growing proportion of cancelled runs, and investigate before the problem escalates.
What Counts Tell You
Run count metrics answer questions like:
How many times did this automation run over a given period?
What proportion of runs succeeded versus failed?
Is the failure rate trending upward or downward over time?
Are there spikes in cancelled or waiting runs that suggest a bottleneck?
Run Duration Metrics
Run duration metrics capture how long each execution takes. Every run records its total execution time, and Insights surfaces this as trends and aggregates so you can monitor whether your automation is getting faster or slower.
How Duration Is Recorded
Duration is tracked at two levels:
Level | What Is Captured |
|---|---|
Run level | The total execution time for the entire run, displayed as the Duration column in Run History and as a duration pill in run details. |
Step level | Each step records its own timing: "This step took {time} to execute" with the exact From (start time) and To (end time). Steps may also show "This step was cached & took {time} to execute" or "This step was not executed." |
Insights aggregates run-level durations across many executions, letting you see whether run times are stable, improving, or degrading over time.
What Duration Tells You
Duration metrics answer questions like:
How long does a typical run take?
Are run times getting longer, which might indicate a performance problem or growing data volumes?
Are there outlier runs that took much longer than usual?
How Metrics Are Collected
All metrics displayed in Insights come from recorded runs. This means three conditions must be met before metrics appear:
The automation must be deployed.
The automation must have actually run at least a few times.
Run logging must be enabled — runs are not counted while logging is off.
When run logging is enabled, each execution records the data that feeds these metrics: the run's start/end time and duration, its execution status (successful, failed, waiting, cancelled), and step-by-step details. If run logging is disabled, new runs will not be recorded and will not appear in Insights.
Note: The layout of the Insights dashboard is a configured dashboard, so the exact charts and visualizations depend on how your workspace has set it up. However, all charts are built from these same two underlying metric categories — run counts and run duration.
Notes
Insights is read-only — you cannot edit automation data or run configurations from this screen. It is for monitoring, not changing the automation.
If Insights appears empty or incomplete, check that the automation has been deployed, has run, and that run logging is enabled. Give it time and use a wide enough date range — trends need several runs to show.
The Runs screen and Insights serve different purposes: use the Runs screen to investigate "what happened in this run?" and use Insights to answer "is this automation healthy lately?"
As well as the per-automation Insights tab, the automations area provides a module-level Insights view that aggregates metrics across all automations, giving you a portfolio-level picture of automation health.
Ensure run logging stays enabled for any automation you want to monitor — any automation with logging off will not contribute data to Insights, creating blind spots in your metrics.