


The module-level Insights view aggregates run data across every automation in your workspace, giving you a portfolio-level picture of automation health without having to visit each automation individually.
Overview
While each automation has its own Insights tab for drilling into individual performance, the automations area also provides a module-level Insights view that aggregates data across all your automations. This is the right starting point for monitoring overall automation health — identifying which automations run most frequently, and where failures concentrate across your workspace.
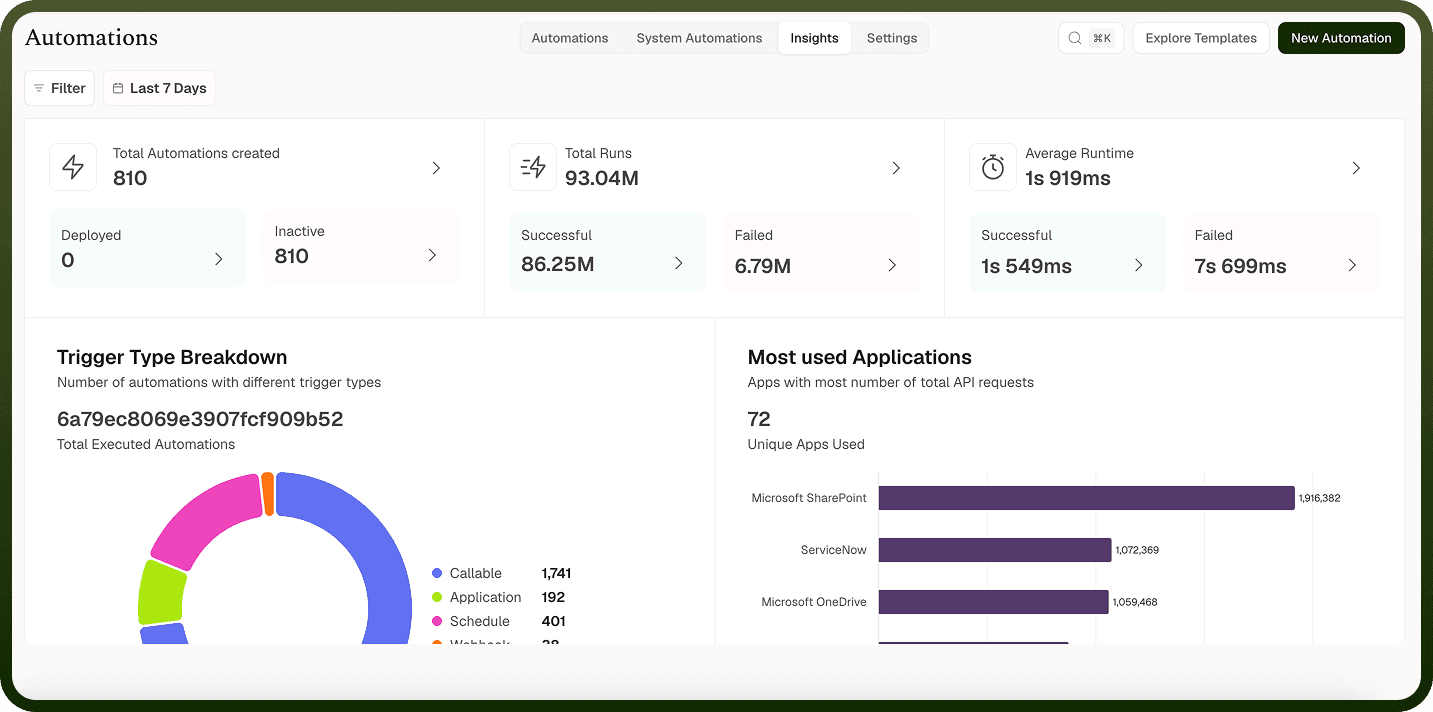
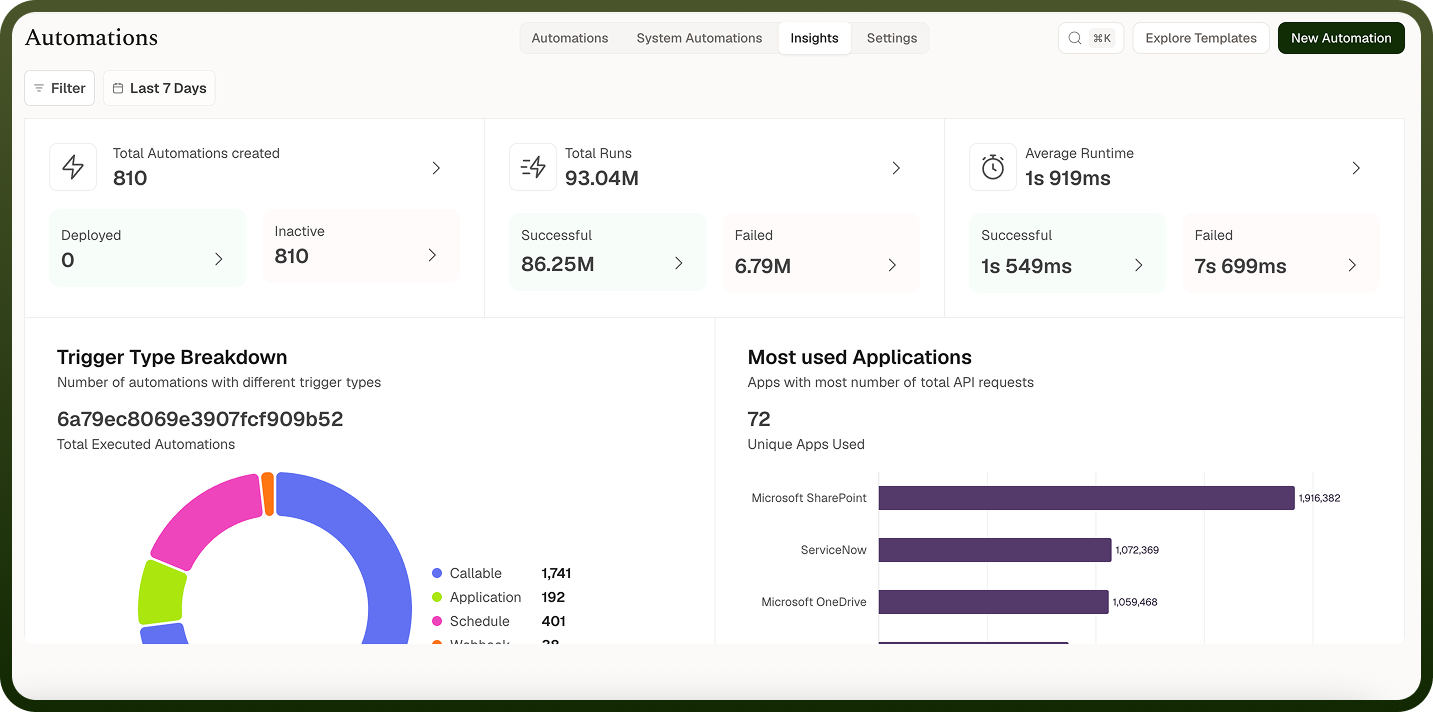
Use the module-level view for a portfolio perspective: which automations are most active, and which ones have the highest failure rates. Once you spot a pattern or a problem area, navigate to the individual automation's Insights tab or Runs screen to investigate further.
Note: Accessing the module-level Insights view requires the view-insights permission for the automations area. If you cannot see this view, contact your workspace administrator.
Accessing Module-Level Insights
Go to the Automations area of your workspace.
Select Insights from the top-level navigation within the automations area.
The dashboard loads with aggregated metrics drawn from run data across all automations.
This is a read-only view. You cannot edit automations or run configurations from this screen.
Available Metrics
The module-level Insights view is built from the same two categories of run metrics used in per-automation Insights — run counts and run duration — aggregated across all automations in the workspace.
Metric | Description |
|---|---|
Run counts (by automation) | Total executions per automation over the selected period, broken down by run status. Lets you see which automations are most active and which have the highest proportion of failures. |
Failure concentration | Where failed runs concentrate across your automation portfolio — which automations account for the most failures — so you can prioritize investigation. |
Run duration | Execution duration aggregated across runs, surfacing automations whose run times are outliers relative to the rest of the workspace. |
Note: Like per-automation Insights, the module-level view only reflects executions that were logged. Automations with run logging disabled do not contribute data to this view.
Filtering & Comparing
The module-level Insights view is built as a configured dashboard, so the available filter and comparison controls depend on how your workspace has set up the view. In general, you can narrow the data by time range to focus on a specific period — for example, the past week or month — which is useful when investigating an incident or reviewing performance after a release.
To compare individual automations in depth, use the module-level view to identify which automations deserve attention, then navigate to each automation's own Insights tab for a focused breakdown of that automation's run counts and duration trends.
Notes
To make the most of it:
Use the module-level view as your first stop during an incident — it quickly shows which automations have elevated failure rates so you know where to focus your investigation.
Make a habit of reviewing the module-level Insights periodically to catch slowly degrading automations before they become critical — a gradual rise in failures is easier to spot in an aggregated view than by checking each automation individually.
Ensure run logging is enabled across all automations you care about; any automation with logging off will be invisible to this view, creating blind spots in your workspace health picture.
Combine this view with module-level alerts (configured at Automations › Settings › Alerts) so that significant failure spikes trigger a notification automatically, rather than relying on you to check the dashboard manually.