


The Insights tab gives you a read-only performance dashboard for an individual automation — aggregating run counts, outcomes, and durations across many executions so you can judge overall health at a glance, rather than reading one run at a time.
Overview
The Insights tab is a configured dashboard of an automation's performance over time. It rolls many executions up into charts and totals so you can spot trends — a rising failure rate, runs getting slower — without reading through individual run records.
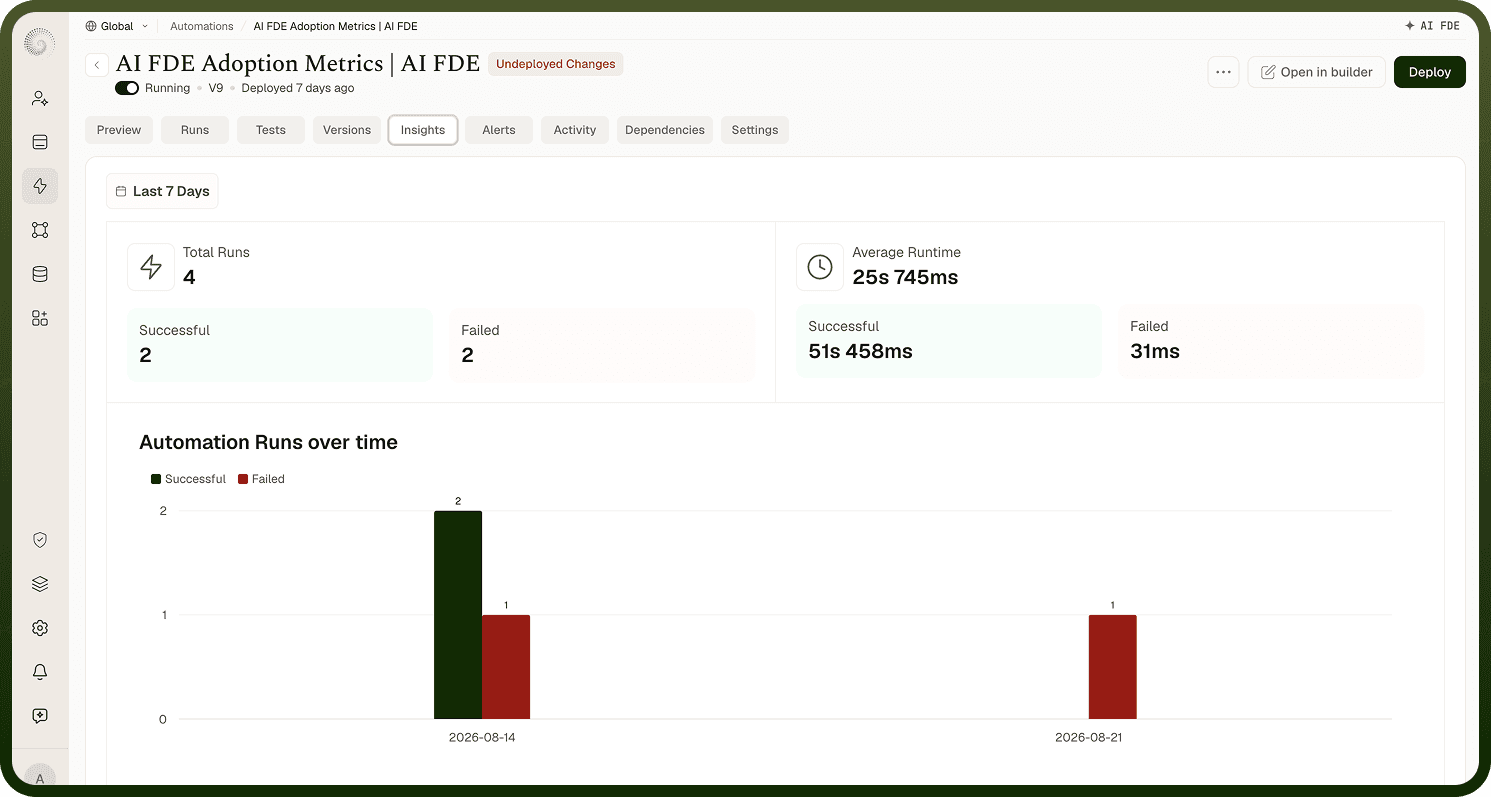
Insights and the Runs screen answer different questions. The Runs screen lists individual executions with their step-by-step detail and is where you go to debug one specific run. Insights aggregates across many runs into metrics and trends — totals, outcome breakdowns, and durations over a period — and is where you go to judge whether the automation is healthy over time. Use Runs to investigate "what happened in this run?"; use Insights to answer "is this automation healthy lately?"
Note: Insights is read-only — you cannot edit run data or automation configuration from this tab.
Accessing the Insights Dashboard
Open the automation you want to inspect.
Select the Insights tab within the automation detail view.
The dashboard loads with charts and totals drawn from that automation's recorded run history.
Note: The Insights tab will appear empty until the automation has been deployed and has run at least a few times with run logging enabled. If you see little or no data, verify that the automation is deployed, has executed, and that run logging is turned on in Settings.
Metrics Available
Insights is built from two categories of run metrics. Together they tell you the volume, reliability, and speed of an automation over time.
Metric | Description | Time Range |
|---|---|---|
Run counts | How many times the automation ran, broken down by run status (successful, failed, and so on). Tells you volume and reliability — the proportion of runs that ended in each state. | Configurable date range |
Run duration | How long individual runs took from trigger to completion. Tells you speed and lets you detect whether executions are becoming slower over time. | Configurable date range |
Because these metrics are derived from recorded runs, they only reflect executions that were logged. Runs that occurred while run logging was disabled do not contribute to Insights figures.
Run Volume Chart
The run volume section of the dashboard shows how many times the automation ran over the selected period, with runs broken down by their outcome status — for example, how many succeeded versus how many failed. This lets you see total activity at a glance and identify whether the proportion of failed runs is growing or stable.
The exact chart layout depends on how your workspace has configured the Insights dashboard. The underlying data always comes from the automation's recorded run statuses.
Duration Trends
The duration section shows how long runs are taking over time. Use it to detect regressions — if the automation was consistently completing in a few seconds and is now taking much longer, the trend will show the shift even before individual failures appear. Duration data reflects wall-clock time from trigger to completion for each logged run.
Error Analysis
Failed runs contribute to the count breakdowns visible in the run volume section of the dashboard. By comparing the proportion of failed runs to total runs over a period you can identify failure hotspots — time windows where failures spiked — and correlate them with deployments or upstream changes.
To investigate the detail of a specific failure, switch to the Runs tab and open the individual run record. Insights shows the aggregate picture; Runs gives you the step-level trace and error message for a specific execution.
Notes
To make the most of it:
Keep run logging enabled at all times for automations you care about monitoring — Insights only reflects logged runs, so gaps in logging create gaps in the dashboard.
Use Insights to spot trends (a rising failure rate, increasing duration) and then switch to the Runs tab to drill into specific executions that drove those trends.
Give a newly deployed automation time and enough runs before relying on its Insights data — trends need several executions to become meaningful.
For a workspace-wide view across all your automations, use the module-level Insights view at Automations › Insights rather than visiting each automation's tab individually.